

122
Z. Lu and G. Zhu
0.0%
2.0%
4.0%
6.0%
8.0%
10.0%
12.0%
2009 2010 2011 2012 2013 2014 2015 2016 2017 2018 2019
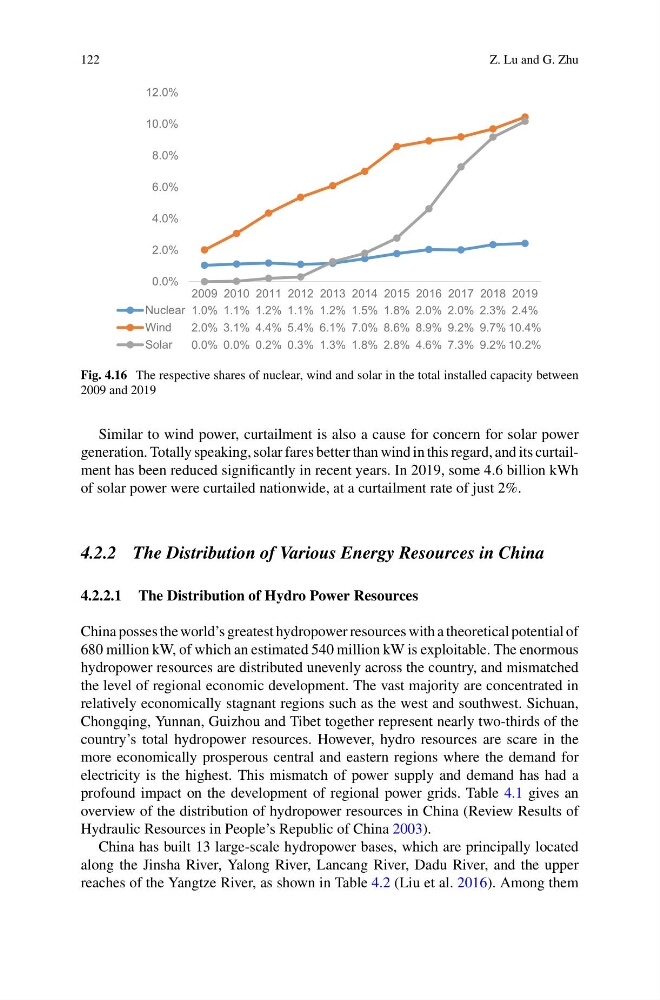
Nuclear 1.0% 1.1% 1.2% 1.1% 1.2% 1.5% 1.8% 2.0% 2.0% 2.3% 2.4%
Wind
2.0% 3.1% 4.4% 5.4% 6.1% 7.0% 8.6% 8.9% 9.2% 9.7% 10.4%
Solar
0.0% 0.0% 0.2% 0.3% 1.3% 1.8% 2.8% 4.6% 7.3% 9.2% 10.2%
Fig. 4.16 The respective shares of nuclear, wind and solar in the total installed capacity between
2009 and 2019
Similar to wind power, curtailment is also a cause for concern for solar power
generation. Totally speaking, solar fares better than wind in this regard, and its curtailment has been reduced significantly in recent years. In 2019, some 4.6 billion kWh
of solar power were curtailed nationwide, at a curtailment rate of just 2%.
4.2.2 The Distribution of Various Energy Resources in China
4.2.2.1 The Distribution of Hydro Power Resources
China posses the world’s greatest hydropower resources with a theoretical potential of
680 million kW, of which an estimated 540 million kW is exploitable. The enormous
hydropower resources are distributed unevenly across the country, and mismatched
the level of regional economic development. The vast majority are concentrated in
relatively economically stagnant regions such as the west and southwest. Sichuan,
Chongqing, Yunnan, Guizhou and Tibet together represent nearly two-thirds of the
country’s total hydropower resources. However, hydro resources are scare in the
more economically prosperous central and eastern regions where the demand for
electricity is the highest. This mismatch of power supply and demand has had a
profound impact on the development of regional power grids. Table 4.1 gives an
overview of the distribution of hydropower resources in China (Review Results of
Hydraulic Resources in People’s Republic of China 2003).
China has built 13 large-scale hydropower bases, which are principally located
along the Jinsha River, Yalong River, Lancang River, Dadu River, and the upper
reaches of the Yangtze River, as shown in Table 4.2 (Liu et al. 2016). Among them
Z. Lu and G. Zhu
0.0%
2.0%
4.0%
6.0%
8.0%
10.0%
12.0%
2009 2010 2011 2012 2013 2014 2015 2016 2017 2018 2019
Nuclear 1.0% 1.1% 1.2% 1.1% 1.2% 1.5% 1.8% 2.0% 2.0% 2.3% 2.4%
Wind
2.0% 3.1% 4.4% 5.4% 6.1% 7.0% 8.6% 8.9% 9.2% 9.7% 10.4%
Solar
0.0% 0.0% 0.2% 0.3% 1.3% 1.8% 2.8% 4.6% 7.3% 9.2% 10.2%
Fig. 4.16 The respective shares of nuclear, wind and solar in the total installed capacity between
2009 and 2019
Similar to wind power, curtailment is also a cause for concern for solar power
generation. Totally speaking, solar fares better than wind in this regard, and its curtailment has been reduced significantly in recent years. In 2019, some 4.6 billion kWh
of solar power were curtailed nationwide, at a curtailment rate of just 2%.
4.2.2 The Distribution of Various Energy Resources in China
4.2.2.1 The Distribution of Hydro Power Resources
China posses the world’s greatest hydropower resources with a theoretical potential of
680 million kW, of which an estimated 540 million kW is exploitable. The enormous
hydropower resources are distributed unevenly across the country, and mismatched
the level of regional economic development. The vast majority are concentrated in
relatively economically stagnant regions such as the west and southwest. Sichuan,
Chongqing, Yunnan, Guizhou and Tibet together represent nearly two-thirds of the
country’s total hydropower resources. However, hydro resources are scare in the
more economically prosperous central and eastern regions where the demand for
electricity is the highest. This mismatch of power supply and demand has had a
profound impact on the development of regional power grids. Table 4.1 gives an
overview of the distribution of hydropower resources in China (Review Results of
Hydraulic Resources in People’s Republic of China 2003).
China has built 13 large-scale hydropower bases, which are principally located
along the Jinsha River, Yalong River, Lancang River, Dadu River, and the upper
reaches of the Yangtze River, as shown in Table 4.2 (Liu et al. 2016). Among them