

120
Z. Lu and G. Zhu
0.0%
2.0%
4.0%
6.0%
8.0%
10.0%
12.0%
0
5000
10000
15000
20000
25000
2009 2010 2011 2012 2013 2014 2015 2016 2017 2018 2019
Installed Capacity (10,000 kW)
Proportion
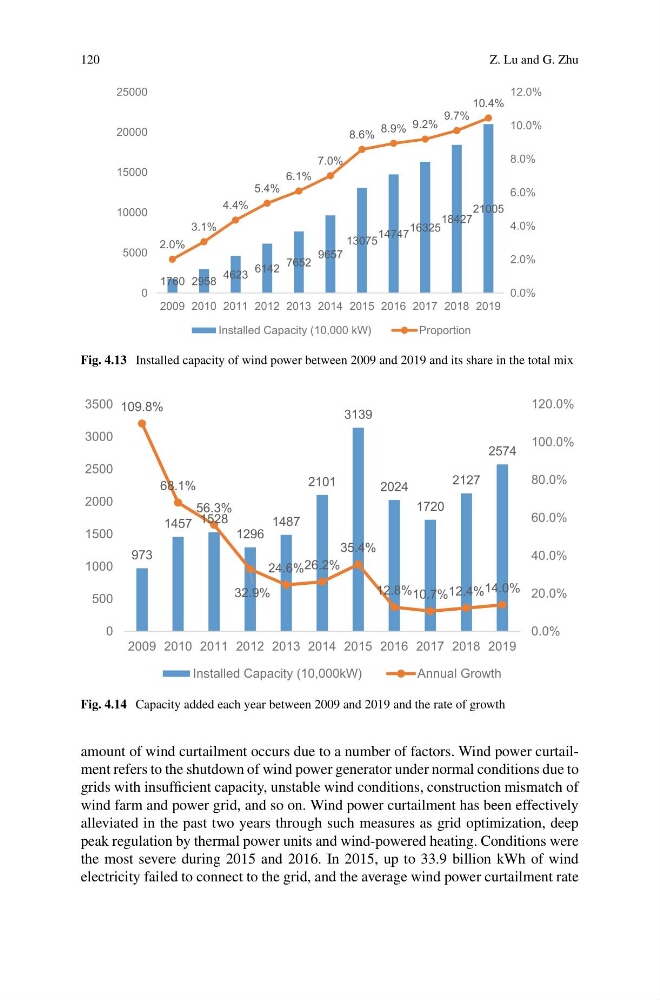
Fig. 4.13 Installed capacity of wind power between 2009 and 2019 and its share in the total mix
0.0%
20.0%
40.0%
60.0%
80.0%
100.0%
120.0%
0
500
1000
1500
2000
2500
3000
3500
2009 2010 2011 2012 2013 2014 2015 2016 2017 2018 2019
Installed Capacity (10,000kW)
Annual Growth
Fig. 4.14 Capacity added each year between 2009 and 2019 and the rate of growth
amount of wind curtailment occurs due to a number of factors. Wind power curtailment refers to the shutdown of wind power generator under normal conditions due to
grids with insufficient capacity, unstable wind conditions, construction mismatch of
wind farm and power grid, and so on. Wind power curtailment has been effectively
alleviated in the past two years through such measures as grid optimization, deep
peak regulation by thermal power units and wind-powered heating. Conditions were
the most severe during 2015 and 2016. In 2015, up to 33.9 billion kWh of wind
electricity failed to connect to the grid, and the average wind power curtailment rate
Z. Lu and G. Zhu
0.0%
2.0%
4.0%
6.0%
8.0%
10.0%
12.0%
0
5000
10000
15000
20000
25000
2009 2010 2011 2012 2013 2014 2015 2016 2017 2018 2019
Installed Capacity (10,000 kW)
Proportion
Fig. 4.13 Installed capacity of wind power between 2009 and 2019 and its share in the total mix
0.0%
20.0%
40.0%
60.0%
80.0%
100.0%
120.0%
0
500
1000
1500
2000
2500
3000
3500
2009 2010 2011 2012 2013 2014 2015 2016 2017 2018 2019
Installed Capacity (10,000kW)
Annual Growth
Fig. 4.14 Capacity added each year between 2009 and 2019 and the rate of growth
amount of wind curtailment occurs due to a number of factors. Wind power curtailment refers to the shutdown of wind power generator under normal conditions due to
grids with insufficient capacity, unstable wind conditions, construction mismatch of
wind farm and power grid, and so on. Wind power curtailment has been effectively
alleviated in the past two years through such measures as grid optimization, deep
peak regulation by thermal power units and wind-powered heating. Conditions were
the most severe during 2015 and 2016. In 2015, up to 33.9 billion kWh of wind
electricity failed to connect to the grid, and the average wind power curtailment rate