

The hydrodynamic radius of a particle can be obtained from its diffusion
coefficient, and thus, from dynamic light scattering data via rearrangement of the Stokes–Einstein equation:
r H =
k B T
6πμD
(6.21)
In this equation r H is the hydrodynamic radius, k B is the Boltzmann
constant, T is temperature, h is the solution viscosity, and D is the diffusion coefficient. As previously discussed, the larger the particle, the
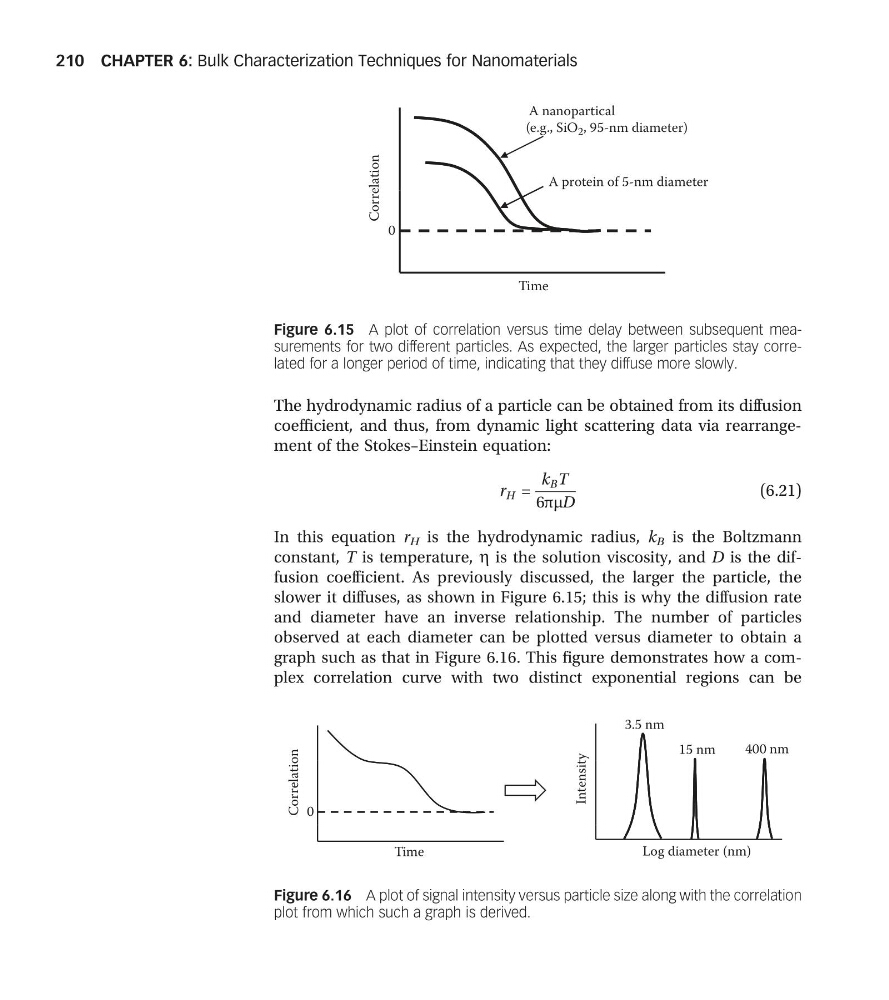
slower it diffuses, as shown in Figure 6.15; this is why the diffusion rate
and diameter have an inverse relationship. The number of particles
observed at each diameter can be plotted versus diameter to obtain a
graph such as that in Figure 6.16. This figure demonstrates how a complex correlation curve with two distinct exponential regions can be
3.5 nm
15 nm
400 nm
Correlation
0
Intensity
Time
Log diameter (nm)
Figure 6.16 A plot of signal intensity versus particle size along with the correlation
plot from which such a graph is derived.
A nanopartical
(e.g., SiO 2 , 95-nm diameter)
A protein of 5-nm diameter
Correlation
0
Time
Figure 6.15 A plot of correlation versus time delay between subsequent measurements for two different particles. As expected, the larger particles stay correlated for a longer period of time, indicating that they diffuse more slowly.
CHAPTER 6: Bulk Characterization Techniques for Nanomaterials
210
coefficient, and thus, from dynamic light scattering data via rearrangement of the Stokes–Einstein equation:
r H =
k B T
6πμD
(6.21)
In this equation r H is the hydrodynamic radius, k B is the Boltzmann
constant, T is temperature, h is the solution viscosity, and D is the diffusion coefficient. As previously discussed, the larger the particle, the
slower it diffuses, as shown in Figure 6.15; this is why the diffusion rate
and diameter have an inverse relationship. The number of particles
observed at each diameter can be plotted versus diameter to obtain a
graph such as that in Figure 6.16. This figure demonstrates how a complex correlation curve with two distinct exponential regions can be
3.5 nm
15 nm
400 nm
Correlation
0
Intensity
Time
Log diameter (nm)
Figure 6.16 A plot of signal intensity versus particle size along with the correlation
plot from which such a graph is derived.
A nanopartical
(e.g., SiO 2 , 95-nm diameter)
A protein of 5-nm diameter
Correlation
0
Time
Figure 6.15 A plot of correlation versus time delay between subsequent measurements for two different particles. As expected, the larger particles stay correlated for a longer period of time, indicating that they diffuse more slowly.
CHAPTER 6: Bulk Characterization Techniques for Nanomaterials
210