

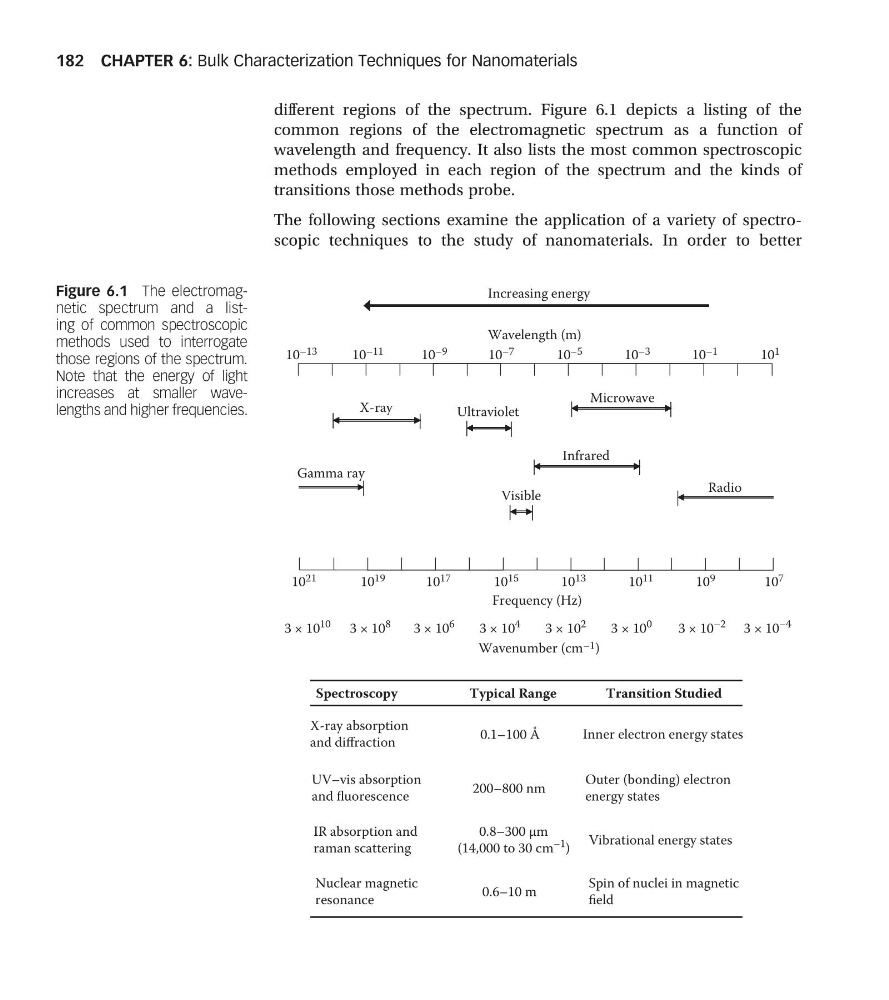
different regions of the spectrum. Figure 6.1 depicts a listing of the
common regions of the electromagnetic spectrum as a function of
wavelength and frequency. It also lists the most common spectroscopic
methods employed in each region of the spectrum and the kinds of
transitions those methods probe.
The following sections examine the application of a variety of spectroscopic techniques to the study of nanomaterials. In order to better
10 7
10 9
10 11
10 13
10 15
10 17
10 19
10 21
10 –13
10 –11
10 –9
10 –7
10 –5
10 –3
10 –1
10 1
3 × 10
–4
3 × 10
–2
3 × 10
0
3 × 10
2
3 × 10
4
3 × 10
6
3 × 10
8
3 × 10
10
Radio
Microwave
Spin of nuclei in magnetic
field
Vibrational energy states
Outer (bonding) electron
energy states
Inner electron energy states
Transition Studied
Visible
Infrared
Frequency (Hz)
Ultraviolet
Increasing energy
Wavelength (m)
Wavenumber (cm –1 )
0.6–10 m
0.8–300 μm
(14,000 to 30 cm
–1 )
200–800 nm
0.1–100 Å
Typical Range
X-ray
Gamma ray
Nuclear magnetic
resonance
IR absorption and
raman scattering
UV–vis absorption
and fluorescence
Spectroscopy
X-ray absorption
and diffraction
Figure 6.1 The electromagnetic spectrum and a listing of common spectroscopic
methods used to interrogate
those regions of the spectrum.
Note that the energy of light
increases at smaller wavelengths and higher frequencies.
CHAPTER 6: Bulk Characterization Techniques for Nanomaterials
182
common regions of the electromagnetic spectrum as a function of
wavelength and frequency. It also lists the most common spectroscopic
methods employed in each region of the spectrum and the kinds of
transitions those methods probe.
The following sections examine the application of a variety of spectroscopic techniques to the study of nanomaterials. In order to better
10 7
10 9
10 11
10 13
10 15
10 17
10 19
10 21
10 –13
10 –11
10 –9
10 –7
10 –5
10 –3
10 –1
10 1
3 × 10
–4
3 × 10
–2
3 × 10
0
3 × 10
2
3 × 10
4
3 × 10
6
3 × 10
8
3 × 10
10
Radio
Microwave
Spin of nuclei in magnetic
field
Vibrational energy states
Outer (bonding) electron
energy states
Inner electron energy states
Transition Studied
Visible
Infrared
Frequency (Hz)
Ultraviolet
Increasing energy
Wavelength (m)
Wavenumber (cm –1 )
0.6–10 m
0.8–300 μm
(14,000 to 30 cm
–1 )
200–800 nm
0.1–100 Å
Typical Range
X-ray
Gamma ray
Nuclear magnetic
resonance
IR absorption and
raman scattering
UV–vis absorption
and fluorescence
Spectroscopy
X-ray absorption
and diffraction
Figure 6.1 The electromagnetic spectrum and a listing of common spectroscopic
methods used to interrogate
those regions of the spectrum.
Note that the energy of light
increases at smaller wavelengths and higher frequencies.
CHAPTER 6: Bulk Characterization Techniques for Nanomaterials
182