

72
breakfast cereals, nutrition bars, beverages, bakery products, mineral supplements,
weight loss products, infant foods and others.
Prebiotics
The word prebiotic is derived from the Greek phrase “pre- bios” meaning “before
life”. The earliest definition of prebiotic that had a semantic analogy with the term
probiotic, was put forward in 1995 as, “non-digestible food ingredients that beneficially affect the host by selectively stimulating the growth and/or activity of one or
a limited number of bacteria in the colon, thus improving host health” (Gibson and
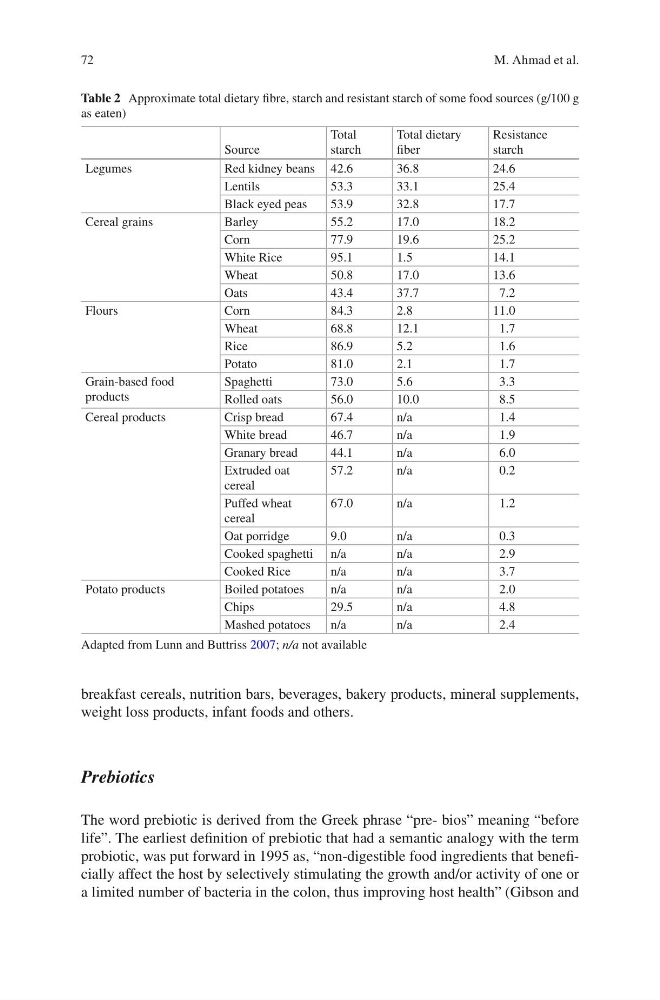
Table 2 Approximate total dietary fibre, starch and resistant starch of some food sources (g/100 g
as eaten)
Source
Total
starch
Total dietary
fiber
Resistance
starch
Legumes
Red kidney beans 42.6
36.8
24.6
Lentils
53.3
33.1
25.4
Black eyed peas
53.9
32.8
17.7
Cereal grains
Barley
55.2
17.0
18.2
Corn
77.9
19.6
25.2
White Rice
95.1
1.5
14.1
Wheat
50.8
17.0
13.6
Oats
43.4
37.7
7.2
Flours
Corn
84.3
2.8
11.0
Wheat
68.8
12.1
1.7
Rice
86.9
5.2
1.6
Potato
81.0
2.1
1.7
Grain-based food
products
Spaghetti
73.0
5.6
3.3
Rolled oats
56.0
10.0
8.5
Cereal products
Crisp bread
67.4
n/a
1.4
White bread
46.7
n/a
1.9
Granary bread
44.1
n/a
6.0
Extruded oat
cereal
57.2
n/a
0.2
Puffed wheat
cereal
67.0
n/a
1.2
Oat porridge
9.0
n/a
0.3
Cooked spaghetti n/a
n/a
2.9
Cooked Rice
n/a
n/a
3.7
Potato products
Boiled potatoes
n/a
n/a
2.0
Chips
29.5
n/a
4.8
Mashed potatoes
n/a
n/a
2.4
Adapted from Lunn and Buttriss 2007; n/a not available
M. Ahmad et al.
breakfast cereals, nutrition bars, beverages, bakery products, mineral supplements,
weight loss products, infant foods and others.
Prebiotics
The word prebiotic is derived from the Greek phrase “pre- bios” meaning “before
life”. The earliest definition of prebiotic that had a semantic analogy with the term
probiotic, was put forward in 1995 as, “non-digestible food ingredients that beneficially affect the host by selectively stimulating the growth and/or activity of one or
a limited number of bacteria in the colon, thus improving host health” (Gibson and
Table 2 Approximate total dietary fibre, starch and resistant starch of some food sources (g/100 g
as eaten)
Source
Total
starch
Total dietary
fiber
Resistance
starch
Legumes
Red kidney beans 42.6
36.8
24.6
Lentils
53.3
33.1
25.4
Black eyed peas
53.9
32.8
17.7
Cereal grains
Barley
55.2
17.0
18.2
Corn
77.9
19.6
25.2
White Rice
95.1
1.5
14.1
Wheat
50.8
17.0
13.6
Oats
43.4
37.7
7.2
Flours
Corn
84.3
2.8
11.0
Wheat
68.8
12.1
1.7
Rice
86.9
5.2
1.6
Potato
81.0
2.1
1.7
Grain-based food
products
Spaghetti
73.0
5.6
3.3
Rolled oats
56.0
10.0
8.5
Cereal products
Crisp bread
67.4
n/a
1.4
White bread
46.7
n/a
1.9
Granary bread
44.1
n/a
6.0
Extruded oat
cereal
57.2
n/a
0.2
Puffed wheat
cereal
67.0
n/a
1.2
Oat porridge
9.0
n/a
0.3
Cooked spaghetti n/a
n/a
2.9
Cooked Rice
n/a
n/a
3.7
Potato products
Boiled potatoes
n/a
n/a
2.0
Chips
29.5
n/a
4.8
Mashed potatoes
n/a
n/a
2.4
Adapted from Lunn and Buttriss 2007; n/a not available
M. Ahmad et al.