

were published in [75, 77, 89]. The values of N, m, a, t
Ã
1 , V 1 , t final and other
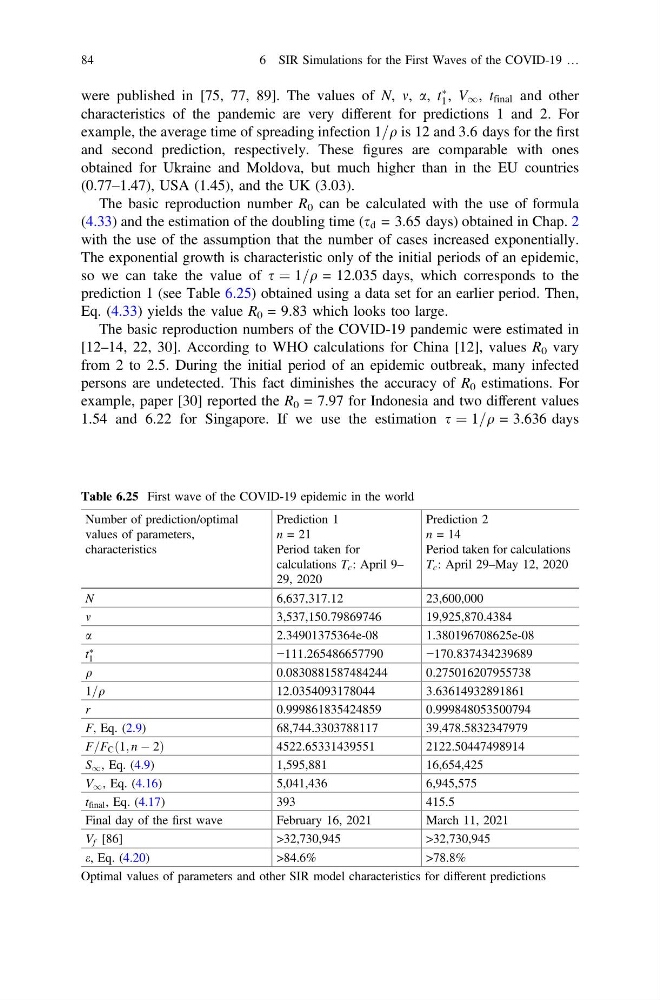
characteristics of the pandemic are very different for predictions 1 and 2. For
example, the average time of spreading infection 1=q is 12 and 3.6 days for the first
and second prediction, respectively. These figures are comparable with ones
obtained for Ukraine and Moldova, but much higher than in the EU countries
(0.77–1.47), USA (1.45), and the UK (3.03).
The basic reproduction number R 0 can be calculated with the use of formula
(4.33) and the estimation of the doubling time (s d = 3.65 days) obtained in Chap. 2
with the use of the assumption that the number of cases increased exponentially.
The exponential growth is characteristic only of the initial periods of an epidemic,
so we can take the value of s ¼ 1=q = 12.035 days, which corresponds to the
prediction 1 (see Table 6.25) obtained using a data set for an earlier period. Then,
Eq. (4.33) yields the value R 0 = 9.83 which looks too large.
The basic reproduction numbers of the COVID-19 pandemic were estimated in
[12–14, 22, 30]. According to WHO calculations for China [12], values R 0 vary
from 2 to 2.5. During the initial period of an epidemic outbreak, many infected
persons are undetected. This fact diminishes the accuracy of R 0 estimations. For
example, paper [30] reported the R 0 = 7.97 for Indonesia and two different values
1.54 and 6.22 for Singapore. If we use the estimation s ¼ 1=q = 3.636 days
Table 6.25 First wave of the COVID-19 epidemic in the world
Number of prediction/optimal
values of parameters,
characteristics
Prediction 1
n = 21
Period taken for
calculations T c : April 9–
29, 2020
Prediction 2
n = 14
Period taken for calculations
T c : April 29–May 12, 2020
N
6,637,317.12
23,600,000
m
3,537,150.79869746
19,925,870.4384
a
2.34901375364e-08
1.380196708625e-08
t
Ã
1
−111.265486657790
−170.837434239689
q
0.0830881587484244
0.275016207955738
1=q
12.0354093178044
3.63614932891861
r
0.999861835424859
0.999848053500794
F, Eq. (2.9)
68,744.3303788117
39,478.5832347979
F=F C ð1; n À 2Þ
4522.65331439551
2122.50447498914
S 1 , Eq. (4.9)
1,595,881
16,654,425
V 1 , Eq. (4.16)
5,041,436
6,945,575
t final , Eq. (4.17)
393
415.5
Final day of the first wave
February 16, 2021
March 11, 2021
V f [86]
>32,730,945
>32,730,945
e, Eq. (4.20)
>84.6%
>78.8%
Optimal values of parameters and other SIR model characteristics for different predictions
84
6 SIR Simulations for the First Waves of the COVID-19 …
Ã
1 , V 1 , t final and other
characteristics of the pandemic are very different for predictions 1 and 2. For
example, the average time of spreading infection 1=q is 12 and 3.6 days for the first
and second prediction, respectively. These figures are comparable with ones
obtained for Ukraine and Moldova, but much higher than in the EU countries
(0.77–1.47), USA (1.45), and the UK (3.03).
The basic reproduction number R 0 can be calculated with the use of formula
(4.33) and the estimation of the doubling time (s d = 3.65 days) obtained in Chap. 2
with the use of the assumption that the number of cases increased exponentially.
The exponential growth is characteristic only of the initial periods of an epidemic,
so we can take the value of s ¼ 1=q = 12.035 days, which corresponds to the
prediction 1 (see Table 6.25) obtained using a data set for an earlier period. Then,
Eq. (4.33) yields the value R 0 = 9.83 which looks too large.
The basic reproduction numbers of the COVID-19 pandemic were estimated in
[12–14, 22, 30]. According to WHO calculations for China [12], values R 0 vary
from 2 to 2.5. During the initial period of an epidemic outbreak, many infected
persons are undetected. This fact diminishes the accuracy of R 0 estimations. For
example, paper [30] reported the R 0 = 7.97 for Indonesia and two different values
1.54 and 6.22 for Singapore. If we use the estimation s ¼ 1=q = 3.636 days
Table 6.25 First wave of the COVID-19 epidemic in the world
Number of prediction/optimal
values of parameters,
characteristics
Prediction 1
n = 21
Period taken for
calculations T c : April 9–
29, 2020
Prediction 2
n = 14
Period taken for calculations
T c : April 29–May 12, 2020
N
6,637,317.12
23,600,000
m
3,537,150.79869746
19,925,870.4384
a
2.34901375364e-08
1.380196708625e-08
t
Ã
1
−111.265486657790
−170.837434239689
q
0.0830881587484244
0.275016207955738
1=q
12.0354093178044
3.63614932891861
r
0.999861835424859
0.999848053500794
F, Eq. (2.9)
68,744.3303788117
39,478.5832347979
F=F C ð1; n À 2Þ
4522.65331439551
2122.50447498914
S 1 , Eq. (4.9)
1,595,881
16,654,425
V 1 , Eq. (4.16)
5,041,436
6,945,575
t final , Eq. (4.17)
393
415.5
Final day of the first wave
February 16, 2021
March 11, 2021
V f [86]
>32,730,945
>32,730,945
e, Eq. (4.20)
>84.6%
>78.8%
Optimal values of parameters and other SIR model characteristics for different predictions
84
6 SIR Simulations for the First Waves of the COVID-19 …