

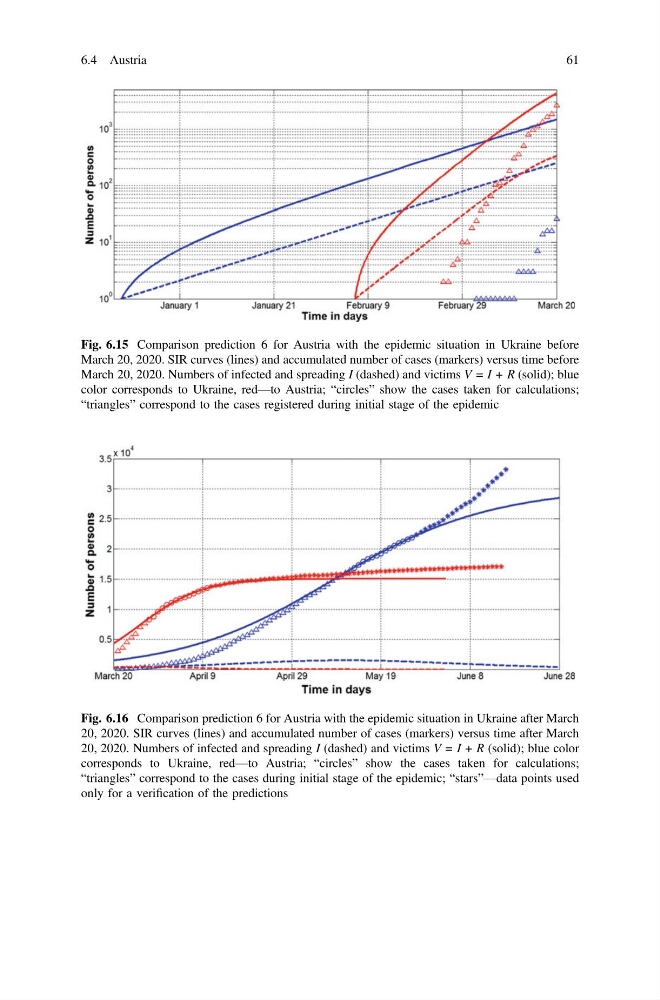
Fig. 6.15 Comparison prediction 6 for Austria with the epidemic situation in Ukraine before
March 20, 2020. SIR curves (lines) and accumulated number of cases (markers) versus time before
March 20, 2020. Numbers of infected and spreading I (dashed) and victims V = I + R (solid); blue
color corresponds to Ukraine, red—to Austria; “circles” show the cases taken for calculations;
“triangles” correspond to the cases registered during initial stage of the epidemic
Fig. 6.16 Comparison prediction 6 for Austria with the epidemic situation in Ukraine after March
20, 2020. SIR curves (lines) and accumulated number of cases (markers) versus time after March
20, 2020. Numbers of infected and spreading I (dashed) and victims V = I + R (solid); blue color
corresponds to Ukraine, red—to Austria; “circles” show the cases taken for calculations;
“triangles” correspond to the cases during initial stage of the epidemic; “stars”—data points used
only for a verification of the predictions
6.4 Austria
61
March 20, 2020. SIR curves (lines) and accumulated number of cases (markers) versus time before
March 20, 2020. Numbers of infected and spreading I (dashed) and victims V = I + R (solid); blue
color corresponds to Ukraine, red—to Austria; “circles” show the cases taken for calculations;
“triangles” correspond to the cases registered during initial stage of the epidemic
Fig. 6.16 Comparison prediction 6 for Austria with the epidemic situation in Ukraine after March
20, 2020. SIR curves (lines) and accumulated number of cases (markers) versus time after March
20, 2020. Numbers of infected and spreading I (dashed) and victims V = I + R (solid); blue color
corresponds to Ukraine, red—to Austria; “circles” show the cases taken for calculations;
“triangles” correspond to the cases during initial stage of the epidemic; “stars”—data points used
only for a verification of the predictions
6.4 Austria
61