

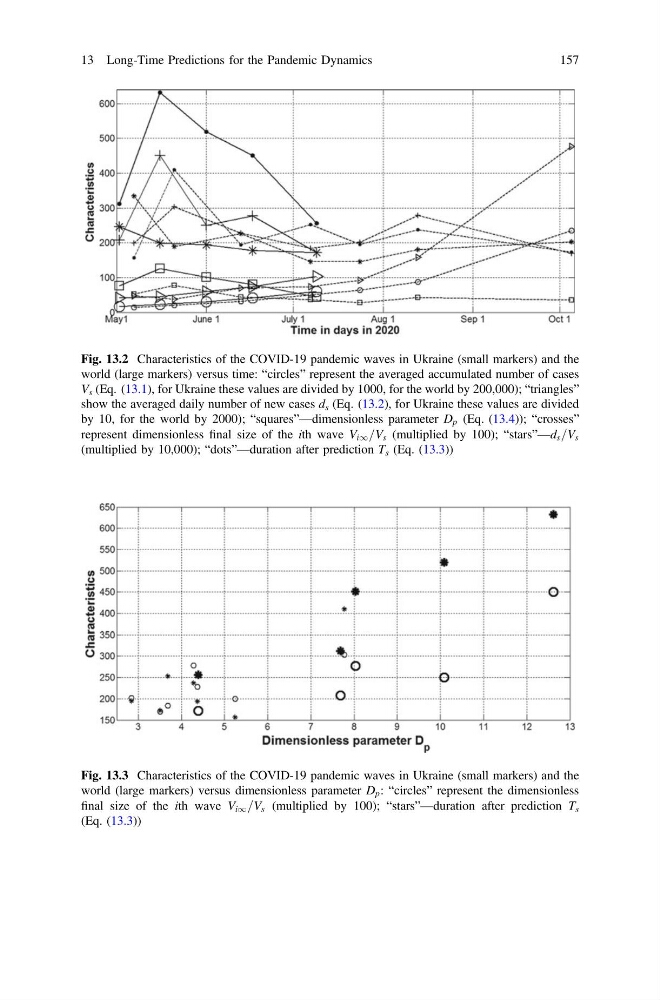
Fig. 13.2 Characteristics of the COVID-19 pandemic waves in Ukraine (small markers) and the
world (large markers) versus time: “circles” represent the averaged accumulated number of cases
V s (Eq. (13.1), for Ukraine these values are divided by 1000, for the world by 200,000); “triangles”
show the averaged daily number of new cases d s (Eq. (13.2), for Ukraine these values are divided
by 10, for the world by 2000); “squares”—dimensionless parameter D p (Eq. (13.4)); “crosses”
represent dimensionless final size of the ith wave V i1 =V s (multiplied by 100); “stars”—d s =V s
(multiplied by 10,000); “dots”—duration after prediction T s (Eq. (13.3))
Fig. 13.3 Characteristics of the COVID-19 pandemic waves in Ukraine (small markers) and the
world (large markers) versus dimensionless parameter D p : “circles” represent the dimensionless
final size of the ith wave V i1 =V s (multiplied by 100); “stars”—duration after prediction T s
(Eq. (13.3))
13 Long-Time Predictions for the Pandemic Dynamics
157
world (large markers) versus time: “circles” represent the averaged accumulated number of cases
V s (Eq. (13.1), for Ukraine these values are divided by 1000, for the world by 200,000); “triangles”
show the averaged daily number of new cases d s (Eq. (13.2), for Ukraine these values are divided
by 10, for the world by 2000); “squares”—dimensionless parameter D p (Eq. (13.4)); “crosses”
represent dimensionless final size of the ith wave V i1 =V s (multiplied by 100); “stars”—d s =V s
(multiplied by 10,000); “dots”—duration after prediction T s (Eq. (13.3))
Fig. 13.3 Characteristics of the COVID-19 pandemic waves in Ukraine (small markers) and the
world (large markers) versus dimensionless parameter D p : “circles” represent the dimensionless
final size of the ith wave V i1 =V s (multiplied by 100); “stars”—duration after prediction T s
(Eq. (13.3))
13 Long-Time Predictions for the Pandemic Dynamics
157