

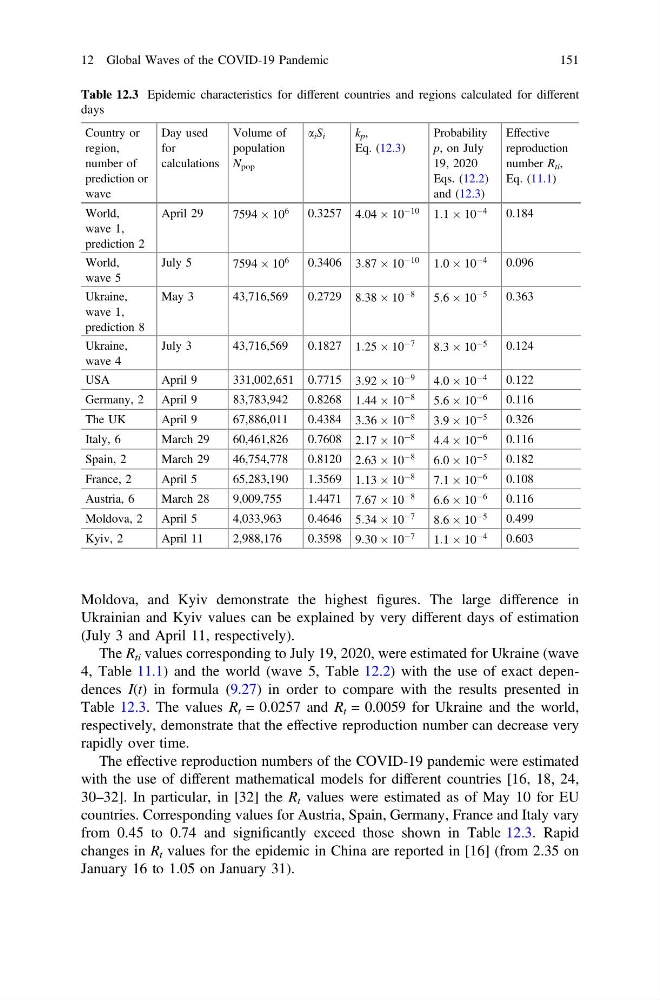
Moldova, and Kyiv demonstrate the highest figures. The large difference in
Ukrainian and Kyiv values can be explained by very different days of estimation
(July 3 and April 11, respectively).
The R ti values corresponding to July 19, 2020, were estimated for Ukraine (wave
4, Table 11.1) and the world (wave 5, Table 12.2) with the use of exact dependences I(t) in formula (9.27) in order to compare with the results presented in
Table 12.3. The values R t = 0.0257 and R t = 0.0059 for Ukraine and the world,
respectively, demonstrate that the effective reproduction number can decrease very
rapidly over time.
The effective reproduction numbers of the COVID-19 pandemic were estimated
with the use of different mathematical models for different countries [16, 18, 24,
30–32]. In particular, in [32] the R t values were estimated as of May 10 for EU
countries. Corresponding values for Austria, Spain, Germany, France and Italy vary
from 0.45 to 0.74 and significantly exceed those shown in Table 12.3. Rapid
changes in R t values for the epidemic in China are reported in [16] (from 2.35 on
January 16 to 1.05 on January 31).
Table 12.3 Epidemic characteristics for different countries and regions calculated for different
days
Country or
region,
number of
prediction or
wave
Day used
for
calculations
Volume of
population
N pop
a i S i
k p ,
Eq. (12.3)
Probability
p, on July
19, 2020
Eqs. (12.2)
and (12.3)
Effective
reproduction
number R ti ,
Eq. (11.1)
World,
wave 1,
prediction 2
April 29
7594 Â 10
6
0.3257 4:04 Â 10
À10
1:1 Â 10
À4
0.184
World,
wave 5
July 5
7594 Â 10
6
0.3406 3:87 Â 10
À10
1:0 Â 10
À4
0.096
Ukraine,
wave 1,
prediction 8
May 3
43,716,569
0.2729 8:38 Â 10
À8
5:6 Â 10
À5
0.363
Ukraine,
wave 4
July 3
43,716,569
0.1827 1:25 Â 10
À7
8:3 Â 10
À5
0.124
USA
April 9
331,002,651 0.7715 3:92 Â 10
À9
4:0 Â 10
À4
0.122
Germany, 2 April 9
83,783,942
0.8268 1:44 Â 10
À8
5:6 Â 10
À6
0.116
The UK
April 9
67,886,011
0.4384 3:36 Â 10
À8
3:9 Â 10
À5
0.326
Italy, 6
March 29
60,461,826
0.7608 2:17 Â 10
À8
4:4 Â 10
À6
0.116
Spain, 2
March 29
46,754,778
0.8120 2:63 Â 10
À8
6:0 Â 10
À5
0.182
France, 2
April 5
65,283,190
1.3569 1:13 Â 10
À8
7:1 Â 10
À6
0.108
Austria, 6
March 28
9,009,755
1.4471 7:67 Â 10
À8
6:6 Â 10
À6
0.116
Moldova, 2
April 5
4,033,963
0.4646 5:34 Â 10
À7
8:6 Â 10
À5
0.499
Kyiv, 2
April 11
2,988,176
0.3598 9:30 Â 10
À7
1:1 Â 10
À4
0.603
12 Global Waves of the COVID-19 Pandemic
151
Ukrainian and Kyiv values can be explained by very different days of estimation
(July 3 and April 11, respectively).
The R ti values corresponding to July 19, 2020, were estimated for Ukraine (wave
4, Table 11.1) and the world (wave 5, Table 12.2) with the use of exact dependences I(t) in formula (9.27) in order to compare with the results presented in
Table 12.3. The values R t = 0.0257 and R t = 0.0059 for Ukraine and the world,
respectively, demonstrate that the effective reproduction number can decrease very
rapidly over time.
The effective reproduction numbers of the COVID-19 pandemic were estimated
with the use of different mathematical models for different countries [16, 18, 24,
30–32]. In particular, in [32] the R t values were estimated as of May 10 for EU
countries. Corresponding values for Austria, Spain, Germany, France and Italy vary
from 0.45 to 0.74 and significantly exceed those shown in Table 12.3. Rapid
changes in R t values for the epidemic in China are reported in [16] (from 2.35 on
January 16 to 1.05 on January 31).
Table 12.3 Epidemic characteristics for different countries and regions calculated for different
days
Country or
region,
number of
prediction or
wave
Day used
for
calculations
Volume of
population
N pop
a i S i
k p ,
Eq. (12.3)
Probability
p, on July
19, 2020
Eqs. (12.2)
and (12.3)
Effective
reproduction
number R ti ,
Eq. (11.1)
World,
wave 1,
prediction 2
April 29
7594 Â 10
6
0.3257 4:04 Â 10
À10
1:1 Â 10
À4
0.184
World,
wave 5
July 5
7594 Â 10
6
0.3406 3:87 Â 10
À10
1:0 Â 10
À4
0.096
Ukraine,
wave 1,
prediction 8
May 3
43,716,569
0.2729 8:38 Â 10
À8
5:6 Â 10
À5
0.363
Ukraine,
wave 4
July 3
43,716,569
0.1827 1:25 Â 10
À7
8:3 Â 10
À5
0.124
USA
April 9
331,002,651 0.7715 3:92 Â 10
À9
4:0 Â 10
À4
0.122
Germany, 2 April 9
83,783,942
0.8268 1:44 Â 10
À8
5:6 Â 10
À6
0.116
The UK
April 9
67,886,011
0.4384 3:36 Â 10
À8
3:9 Â 10
À5
0.326
Italy, 6
March 29
60,461,826
0.7608 2:17 Â 10
À8
4:4 Â 10
À6
0.116
Spain, 2
March 29
46,754,778
0.8120 2:63 Â 10
À8
6:0 Â 10
À5
0.182
France, 2
April 5
65,283,190
1.3569 1:13 Â 10
À8
7:1 Â 10
À6
0.108
Austria, 6
March 28
9,009,755
1.4471 7:67 Â 10
À8
6:6 Â 10
À6
0.116
Moldova, 2
April 5
4,033,963
0.4646 5:34 Â 10
À7
8:6 Â 10
À5
0.499
Kyiv, 2
April 11
2,988,176
0.3598 9:30 Â 10
À7
1:1 Â 10
À4
0.603
12 Global Waves of the COVID-19 Pandemic
151