

Figures 8.14 and 8.15 represent the results of calculations for Ukraine (in red)
and Kyiv (in blue) with the use of Eq. (8.1) (lines); Eqs. (8.2) and (8.3)—small
“triangles” and “stars”. All these calculations use the daily number of accumulated
cases V j . The use of weekly number of cases w i (Eqs. (8.4) and (8.5)) is shown in
Fig. 8.14 by large markers. It can be seen that w i can be successively used to
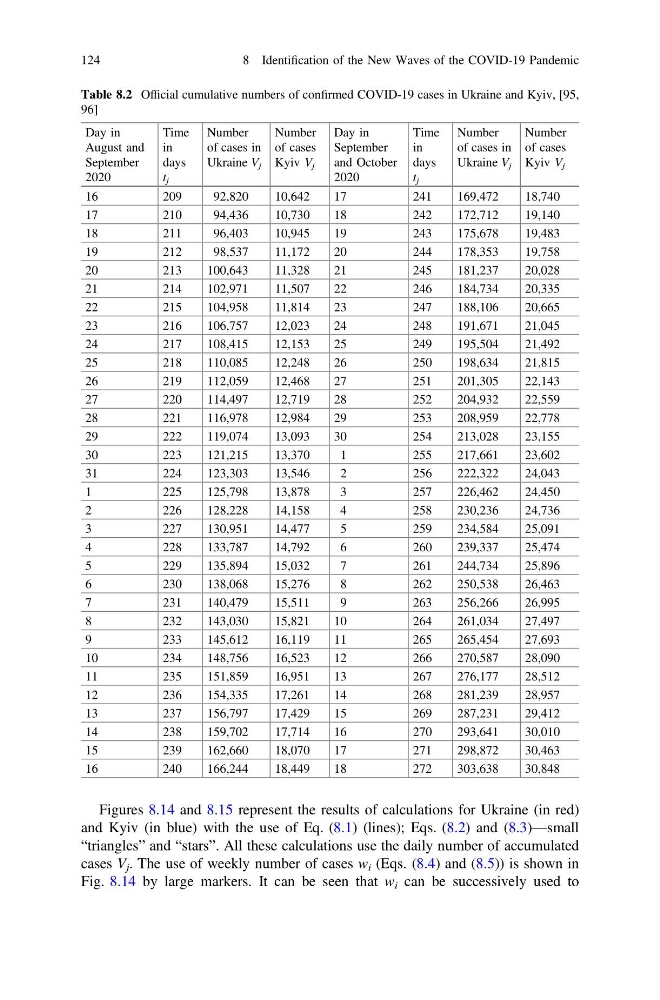
Table 8.2 Official cumulative numbers of confirmed COVID-19 cases in Ukraine and Kyiv, [95,
96]
Day in
August and
September
2020
Time
in
days
t j
Number
of cases in
Ukraine V j
Number
of cases
Kyiv V j
Day in
September
and October
2020
Time
in
days
t j
Number
of cases in
Ukraine V j
Number
of cases
Kyiv V j
16
209
92,820
10,642
17
241
169,472
18,740
17
210
94,436
10,730
18
242
172,712
19,140
18
211
96,403
10,945
19
243
175,678
19,483
19
212
98,537
11,172
20
244
178,353
19,758
20
213
100,643
11,328
21
245
181,237
20,028
21
214
102,971
11,507
22
246
184,734
20,335
22
215
104,958
11,814
23
247
188,106
20,665
23
216
106,757
12,023
24
248
191,671
21,045
24
217
108,415
12,153
25
249
195,504
21,492
25
218
110,085
12,248
26
250
198,634
21,815
26
219
112,059
12,468
27
251
201,305
22,143
27
220
114,497
12,719
28
252
204,932
22,559
28
221
116,978
12,984
29
253
208,959
22,778
29
222
119,074
13,093
30
254
213,028
23,155
30
223
121,215
13,370
1
255
217,661
23,602
31
224
123,303
13,546
2
256
222,322
24,043
1
225
125,798
13,878
3
257
226,462
24,450
2
226
128,228
14,158
4
258
230,236
24,736
3
227
130,951
14,477
5
259
234,584
25,091
4
228
133,787
14,792
6
260
239,337
25,474
5
229
135,894
15,032
7
261
244,734
25,896
6
230
138,068
15,276
8
262
250,538
26,463
7
231
140,479
15,511
9
263
256,266
26,995
8
232
143,030
15,821
10
264
261,034
27,497
9
233
145,612
16,119
11
265
265,454
27,693
10
234
148,756
16,523
12
266
270,587
28,090
11
235
151,859
16,951
13
267
276,177
28,512
12
236
154,335
17,261
14
268
281,239
28,957
13
237
156,797
17,429
15
269
287,231
29,412
14
238
159,702
17,714
16
270
293,641
30,010
15
239
162,660
18,070
17
271
298,872
30,463
16
240
166,244
18,449
18
272
303,638
30,848
124
8 Identification of the New Waves of the COVID-19 Pandemic
and Kyiv (in blue) with the use of Eq. (8.1) (lines); Eqs. (8.2) and (8.3)—small
“triangles” and “stars”. All these calculations use the daily number of accumulated
cases V j . The use of weekly number of cases w i (Eqs. (8.4) and (8.5)) is shown in
Fig. 8.14 by large markers. It can be seen that w i can be successively used to
Table 8.2 Official cumulative numbers of confirmed COVID-19 cases in Ukraine and Kyiv, [95,
96]
Day in
August and
September
2020
Time
in
days
t j
Number
of cases in
Ukraine V j
Number
of cases
Kyiv V j
Day in
September
and October
2020
Time
in
days
t j
Number
of cases in
Ukraine V j
Number
of cases
Kyiv V j
16
209
92,820
10,642
17
241
169,472
18,740
17
210
94,436
10,730
18
242
172,712
19,140
18
211
96,403
10,945
19
243
175,678
19,483
19
212
98,537
11,172
20
244
178,353
19,758
20
213
100,643
11,328
21
245
181,237
20,028
21
214
102,971
11,507
22
246
184,734
20,335
22
215
104,958
11,814
23
247
188,106
20,665
23
216
106,757
12,023
24
248
191,671
21,045
24
217
108,415
12,153
25
249
195,504
21,492
25
218
110,085
12,248
26
250
198,634
21,815
26
219
112,059
12,468
27
251
201,305
22,143
27
220
114,497
12,719
28
252
204,932
22,559
28
221
116,978
12,984
29
253
208,959
22,778
29
222
119,074
13,093
30
254
213,028
23,155
30
223
121,215
13,370
1
255
217,661
23,602
31
224
123,303
13,546
2
256
222,322
24,043
1
225
125,798
13,878
3
257
226,462
24,450
2
226
128,228
14,158
4
258
230,236
24,736
3
227
130,951
14,477
5
259
234,584
25,091
4
228
133,787
14,792
6
260
239,337
25,474
5
229
135,894
15,032
7
261
244,734
25,896
6
230
138,068
15,276
8
262
250,538
26,463
7
231
140,479
15,511
9
263
256,266
26,995
8
232
143,030
15,821
10
264
261,034
27,497
9
233
145,612
16,119
11
265
265,454
27,693
10
234
148,756
16,523
12
266
270,587
28,090
11
235
151,859
16,951
13
267
276,177
28,512
12
236
154,335
17,261
14
268
281,239
28,957
13
237
156,797
17,429
15
269
287,231
29,412
14
238
159,702
17,714
16
270
293,641
30,010
15
239
162,660
18,070
17
271
298,872
30,463
16
240
166,244
18,449
18
272
303,638
30,848
124
8 Identification of the New Waves of the COVID-19 Pandemic