

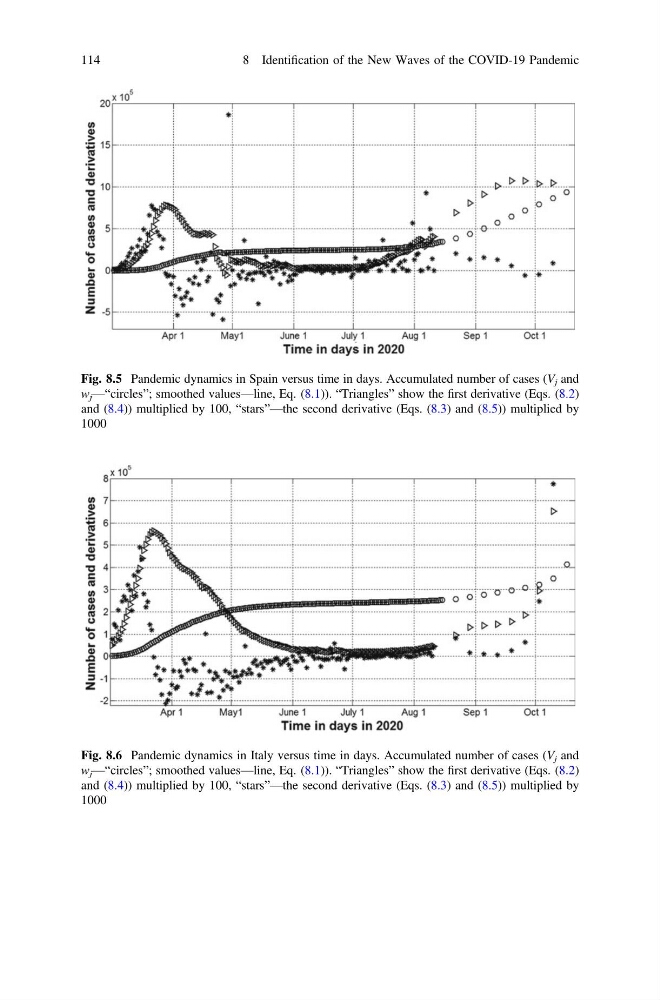
Fig. 8.5 Pandemic dynamics in Spain versus time in days. Accumulated number of cases (V j and
w j —“circles”; smoothed values—line, Eq. (8.1)). “Triangles” show the first derivative (Eqs. (8.2)
and (8.4)) multiplied by 100, “stars”—the second derivative (Eqs. (8.3) and (8.5)) multiplied by
1000
Fig. 8.6 Pandemic dynamics in Italy versus time in days. Accumulated number of cases (V j and
w j —“circles”; smoothed values—line, Eq. (8.1)). “Triangles” show the first derivative (Eqs. (8.2)
and (8.4)) multiplied by 100, “stars”—the second derivative (Eqs. (8.3) and (8.5)) multiplied by
1000
114
8 Identification of the New Waves of the COVID-19 Pandemic
w j —“circles”; smoothed values—line, Eq. (8.1)). “Triangles” show the first derivative (Eqs. (8.2)
and (8.4)) multiplied by 100, “stars”—the second derivative (Eqs. (8.3) and (8.5)) multiplied by
1000
Fig. 8.6 Pandemic dynamics in Italy versus time in days. Accumulated number of cases (V j and
w j —“circles”; smoothed values—line, Eq. (8.1)). “Triangles” show the first derivative (Eqs. (8.2)
and (8.4)) multiplied by 100, “stars”—the second derivative (Eqs. (8.3) and (8.5)) multiplied by
1000
114
8 Identification of the New Waves of the COVID-19 Pandemic