

462
J. M. Kariuki
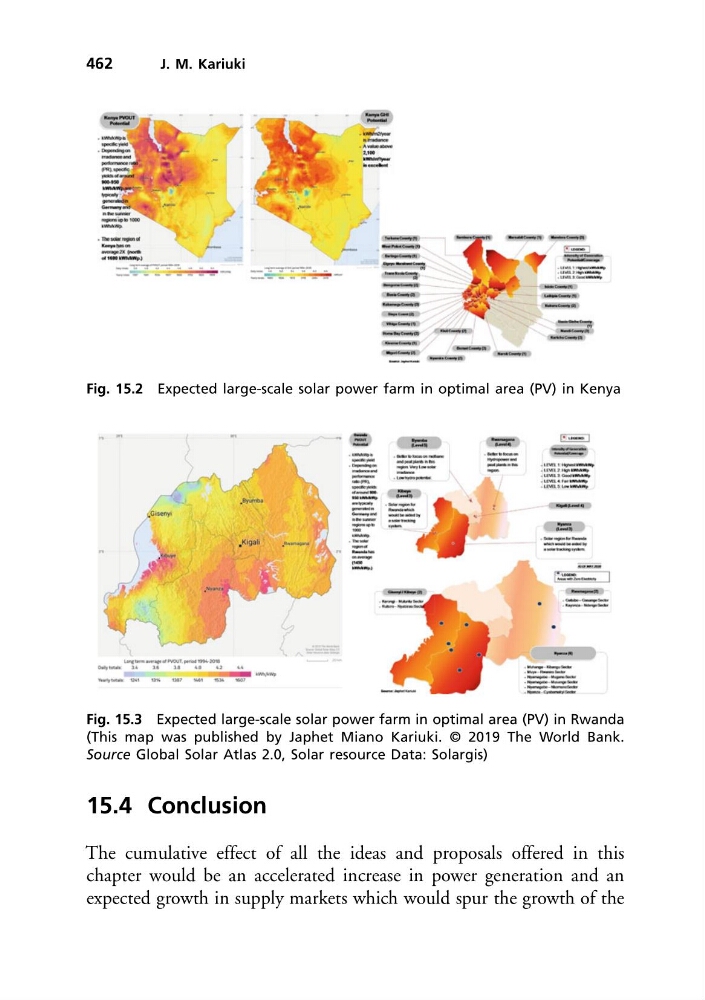
Fig. 15.2 Expected large-scale solar power farm in optimal area (PV) in Kenya
Fig. 15.3 Expected large-scale solar power farm in optimal area (PV) in Rwanda
(This map was published by Japhet Miano Kariuki. © 2019 The World Bank.
Source Global Solar Atlas 2.0, Solar resource Data: Solargis)
15.4 Conclusion
The cumulative effect of all the ideas and proposals offered in this
chapter would be an accelerated increase in power generation and an
expected growth in supply markets which would spur the growth of the
J. M. Kariuki
Fig. 15.2 Expected large-scale solar power farm in optimal area (PV) in Kenya
Fig. 15.3 Expected large-scale solar power farm in optimal area (PV) in Rwanda
(This map was published by Japhet Miano Kariuki. © 2019 The World Bank.
Source Global Solar Atlas 2.0, Solar resource Data: Solargis)
15.4 Conclusion
The cumulative effect of all the ideas and proposals offered in this
chapter would be an accelerated increase in power generation and an
expected growth in supply markets which would spur the growth of the