

13 A Critical Intertemporal Analysis of Uganda’s Fiscal Regime …
409
An interpolating sliding scale with a minimum threshold of 50% below
an R-factor of 1, a maximum threshold of 75% for an R-factor over
three and an interpolating threshold between 50 and 75% for an R-factor
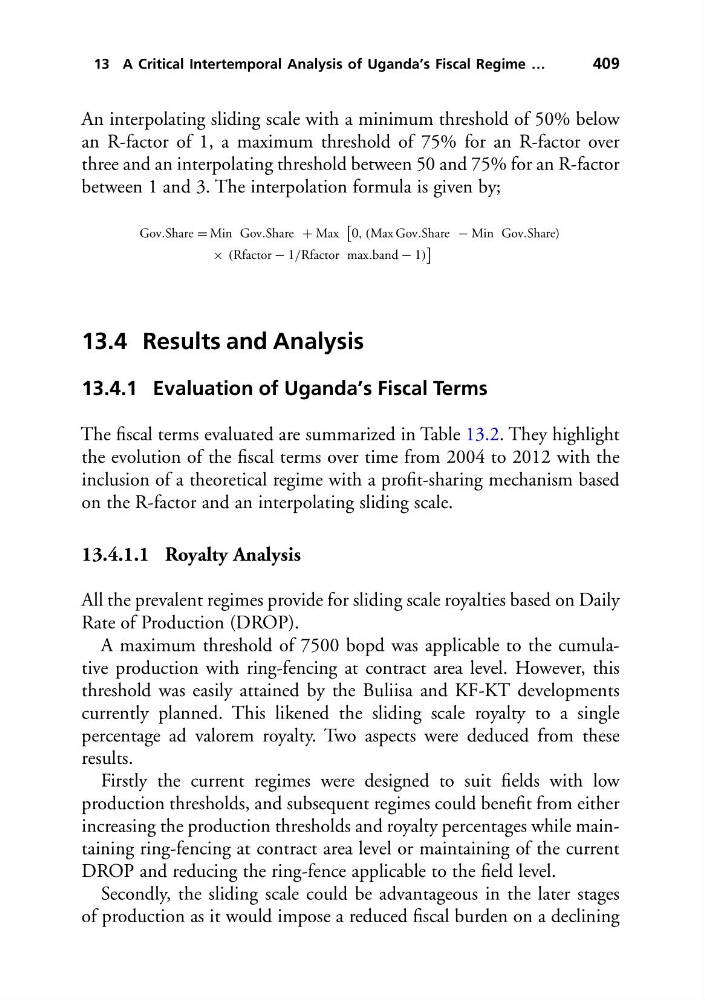
between 1 and 3. The interpolation formula is given by;
Gov.Share = Min Gov.Share + Max
0, (Max Gov.Share − Min Gov.Share)
× (Rfactor − 1/Rfactor max.band − 1)
13.4 Results and Analysis
13.4.1 Evaluation of Uganda’s Fiscal Terms
The fiscal terms evaluated are summarized in Table 13.2. They highlight
the evolution of the fiscal terms over time from 2004 to 2012 with the
inclusion of a theoretical regime with a profit-sharing mechanism based
on the R-factor and an interpolating sliding scale.
13.4.1.1 Royalty Analysis
All the prevalent regimes provide for sliding scale royalties based on Daily
Rate of Production (DROP).
A maximum threshold of 7500 bopd was applicable to the cumulative production with ring-fencing at contract area level. However, this
threshold was easily attained by the Buliisa and KF-KT developments
currently planned. This likened the sliding scale royalty to a single
percentage ad valorem royalty. Two aspects were deduced from these
results.
Firstly the current regimes were designed to suit fields with low
production thresholds, and subsequent regimes could benefit from either
increasing the production thresholds and royalty percentages while maintaining ring-fencing at contract area level or maintaining of the current
DROP and reducing the ring-fence applicable to the field level.
Secondly, the sliding scale could be advantageous in the later stages
of production as it would impose a reduced fiscal burden on a declining
409
An interpolating sliding scale with a minimum threshold of 50% below
an R-factor of 1, a maximum threshold of 75% for an R-factor over
three and an interpolating threshold between 50 and 75% for an R-factor
between 1 and 3. The interpolation formula is given by;
Gov.Share = Min Gov.Share + Max
0, (Max Gov.Share − Min Gov.Share)
× (Rfactor − 1/Rfactor max.band − 1)
13.4 Results and Analysis
13.4.1 Evaluation of Uganda’s Fiscal Terms
The fiscal terms evaluated are summarized in Table 13.2. They highlight
the evolution of the fiscal terms over time from 2004 to 2012 with the
inclusion of a theoretical regime with a profit-sharing mechanism based
on the R-factor and an interpolating sliding scale.
13.4.1.1 Royalty Analysis
All the prevalent regimes provide for sliding scale royalties based on Daily
Rate of Production (DROP).
A maximum threshold of 7500 bopd was applicable to the cumulative production with ring-fencing at contract area level. However, this
threshold was easily attained by the Buliisa and KF-KT developments
currently planned. This likened the sliding scale royalty to a single
percentage ad valorem royalty. Two aspects were deduced from these
results.
Firstly the current regimes were designed to suit fields with low
production thresholds, and subsequent regimes could benefit from either
increasing the production thresholds and royalty percentages while maintaining ring-fencing at contract area level or maintaining of the current
DROP and reducing the ring-fence applicable to the field level.
Secondly, the sliding scale could be advantageous in the later stages
of production as it would impose a reduced fiscal burden on a declining