

5.3 Reversible Flux Motion
91
observed results. In particular, the AC loss energy density for the filament diameter
of 0.51 μm is much smaller than the theoretical prediction, as shown by the dashed
line for small AC field amplitudes. This is caused by the reversible flux motion.
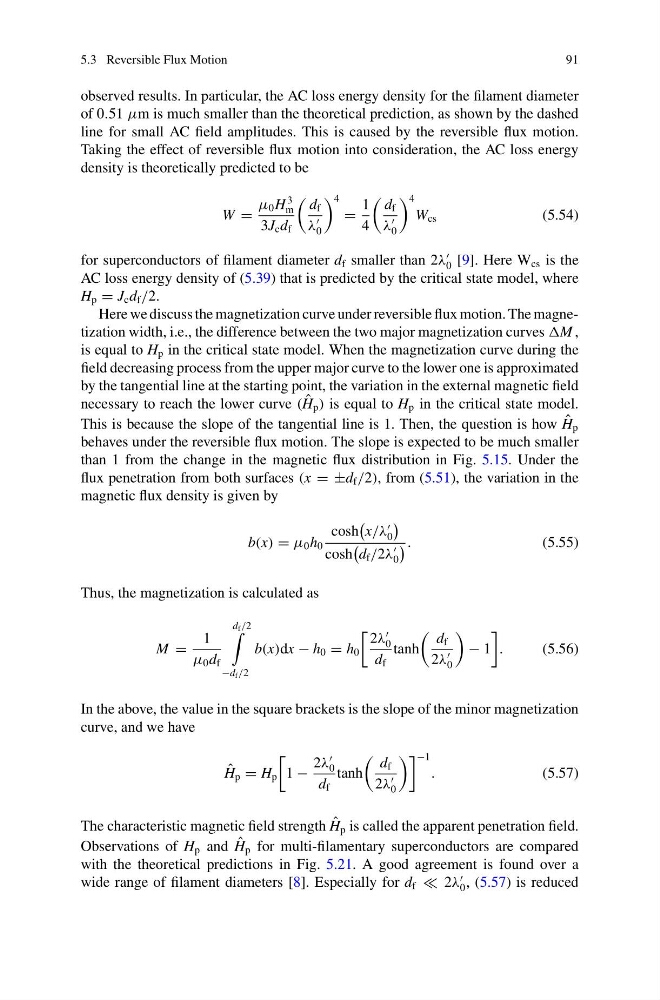
Taking the effect of reversible flux motion into consideration, the AC loss energy
density is theoretically predicted to be
W =
μ 0 H
3
m
3J c d f
d f
λ
0
4
=
1
4
d f
λ
0
4
W cs
(5.54)
for superconductors of filament diameter d f smaller than 2λ
0 [9]. Here W cs is the
AC loss energy density of (5.39) that is predicted by the critical state model, where
H p = J c d f /2.
Here we discuss the magnetization curve under reversible flux motion. The magnetization width, i.e., the difference between the two major magnetization curves M ,
is equal to H p in the critical state model. When the magnetization curve during the
field decreasing process from the upper major curve to the lower one is approximated
by the tangential line at the starting point, the variation in the external magnetic field
necessary to reach the lower curve ( ˆ
H p ) is equal to H p in the critical state model.
This is because the slope of the tangential line is 1. Then, the question is how ˆ
H p
behaves under the reversible flux motion. The slope is expected to be much smaller
than 1 from the change in the magnetic flux distribution in Fig. 5.15. Under the
flux penetration from both surfaces (x = ±d f /2), from (5.51), the variation in the
magnetic flux density is given by
b(x) = μ 0 h 0
cosh
x/λ
0
cosh
d f /2λ
0
.
(5.55)
Thus, the magnetization is calculated as
M =
1
μ 0 d f
d f /2
−d f /2
b(x)dx − h 0 = h 0
2λ
0
d f
tanh
d f
2λ
0
− 1
.
(5.56)
In the above, the value in the square brackets is the slope of the minor magnetization
curve, and we have
ˆ
H p = H p
1 −
2λ
0
d f
tanh
d f
2λ
0
−1
.
(5.57)
The characteristic magnetic field strength ˆ
H p is called the apparent penetration field.
Observations of H p and ˆ
H p for multi-filamentary superconductors are compared
with the theoretical predictions in Fig. 5.21. A good agreement is found over a
wide range of filament diameters [8]. Especially for d f 2λ
0 , (5.57) is reduced
91
observed results. In particular, the AC loss energy density for the filament diameter
of 0.51 μm is much smaller than the theoretical prediction, as shown by the dashed
line for small AC field amplitudes. This is caused by the reversible flux motion.
Taking the effect of reversible flux motion into consideration, the AC loss energy
density is theoretically predicted to be
W =
μ 0 H
3
m
3J c d f
d f
λ
0
4
=
1
4
d f
λ
0
4
W cs
(5.54)
for superconductors of filament diameter d f smaller than 2λ
0 [9]. Here W cs is the
AC loss energy density of (5.39) that is predicted by the critical state model, where
H p = J c d f /2.
Here we discuss the magnetization curve under reversible flux motion. The magnetization width, i.e., the difference between the two major magnetization curves M ,
is equal to H p in the critical state model. When the magnetization curve during the
field decreasing process from the upper major curve to the lower one is approximated
by the tangential line at the starting point, the variation in the external magnetic field
necessary to reach the lower curve ( ˆ
H p ) is equal to H p in the critical state model.
This is because the slope of the tangential line is 1. Then, the question is how ˆ
H p
behaves under the reversible flux motion. The slope is expected to be much smaller
than 1 from the change in the magnetic flux distribution in Fig. 5.15. Under the
flux penetration from both surfaces (x = ±d f /2), from (5.51), the variation in the
magnetic flux density is given by
b(x) = μ 0 h 0
cosh
x/λ
0
cosh
d f /2λ
0
.
(5.55)
Thus, the magnetization is calculated as
M =
1
μ 0 d f
d f /2
−d f /2
b(x)dx − h 0 = h 0
2λ
0
d f
tanh
d f
2λ
0
− 1
.
(5.56)
In the above, the value in the square brackets is the slope of the minor magnetization
curve, and we have
ˆ
H p = H p
1 −
2λ
0
d f
tanh
d f
2λ
0
−1
.
(5.57)
The characteristic magnetic field strength ˆ
H p is called the apparent penetration field.
Observations of H p and ˆ
H p for multi-filamentary superconductors are compared
with the theoretical predictions in Fig. 5.21. A good agreement is found over a
wide range of filament diameters [8]. Especially for d f 2λ
0 , (5.57) is reduced