

236 10 Electrical Properties
Equation (10.5) for the electrical conductivity leads to a voltage–current characteristic like:
I VG
V
=
+
(
)
0 α β
.
(10.6)
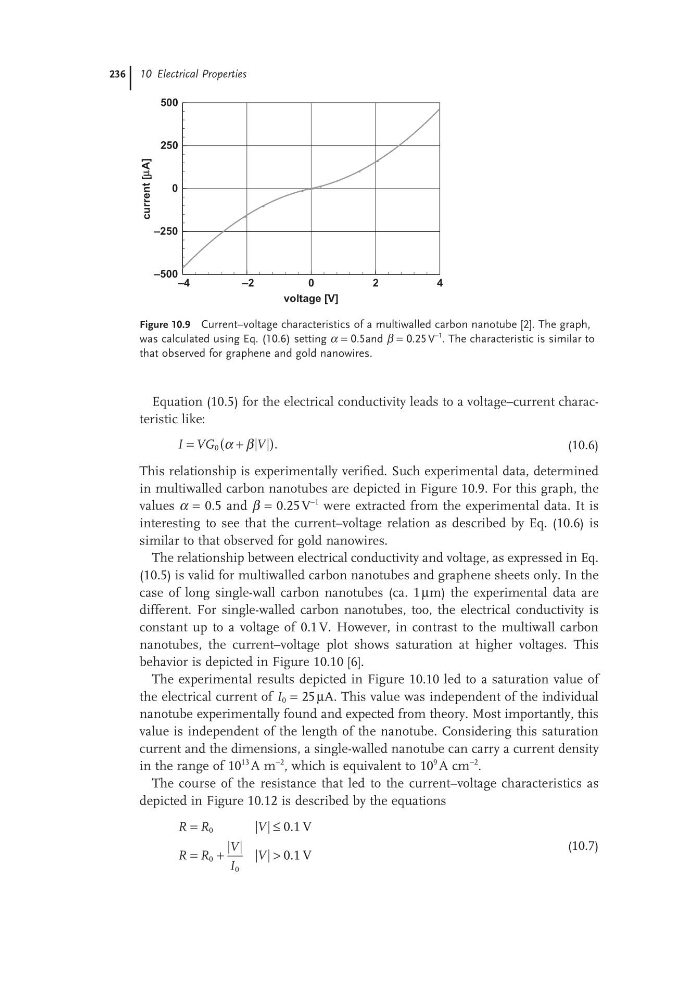
This relationship is experimentally verified. Such experimental data, determined
in multiwalled carbon nanotubes are depicted in Figure 10.9. For this graph, the
values α = 0.5 and β = 0.25 V
−1 were extracted from the experimental data. It is
interesting to see that the current–voltage relation as described by Eq. (10.6) is
similar to that observed for gold nanowires.
The relationship between electrical conductivity and voltage, as expressed in Eq.
(10.5) is valid for multiwalled carbon nanotubes and graphene sheets only. In the
case of long single-wall carbon nanotubes (ca. 1 μm) the experimental data are
different. For single-walled carbon nanotubes, too, the electrical conductivity is
constant up to a voltage of 0.1 V. However, in contrast to the multiwall carbon
nanotubes, the current–voltage plot shows saturation at higher voltages. This
behavior is depicted in Figure 10.10 [6].
The experimental results depicted in Figure 10.10 led to a saturation value of
the electrical current of I 0 = 25 μA. This value was independent of the individual
nanotube experimentally found and expected from theory. Most importantly, this
value is independent of the length of the nanotube. Considering this saturation
current and the dimensions, a single-walled nanotube can carry a current density
in the range of 10
13 A m
−2 , which is equivalent to 10
9 A cm
−2
.
The course of the resistance that led to the current–voltage characteristics as
depicted in Figure 10.12 is described by the equations
R R
V
R R
V
I
V
=
≤
= +
>
0
0
0
0 1
0 1
.
.
V
V
(10.7)
Figure 10.9 Current–voltage characteristics of a multiwalled carbon nanotube [2]. The graph,
was calculated using Eq. (10.6) setting α = 0.5and β = 0.25 V
−1 . The characteristic is similar to
that observed for graphene and gold nanowires.
–4
–2
0
2
4
voltage [V]
–500
–250
0
250
500
current
[µA]
Equation (10.5) for the electrical conductivity leads to a voltage–current characteristic like:
I VG
V
=
+
(
)
0 α β
.
(10.6)
This relationship is experimentally verified. Such experimental data, determined
in multiwalled carbon nanotubes are depicted in Figure 10.9. For this graph, the
values α = 0.5 and β = 0.25 V
−1 were extracted from the experimental data. It is
interesting to see that the current–voltage relation as described by Eq. (10.6) is
similar to that observed for gold nanowires.
The relationship between electrical conductivity and voltage, as expressed in Eq.
(10.5) is valid for multiwalled carbon nanotubes and graphene sheets only. In the
case of long single-wall carbon nanotubes (ca. 1 μm) the experimental data are
different. For single-walled carbon nanotubes, too, the electrical conductivity is
constant up to a voltage of 0.1 V. However, in contrast to the multiwall carbon
nanotubes, the current–voltage plot shows saturation at higher voltages. This
behavior is depicted in Figure 10.10 [6].
The experimental results depicted in Figure 10.10 led to a saturation value of
the electrical current of I 0 = 25 μA. This value was independent of the individual
nanotube experimentally found and expected from theory. Most importantly, this
value is independent of the length of the nanotube. Considering this saturation
current and the dimensions, a single-walled nanotube can carry a current density
in the range of 10
13 A m
−2 , which is equivalent to 10
9 A cm
−2
.
The course of the resistance that led to the current–voltage characteristics as
depicted in Figure 10.12 is described by the equations
R R
V
R R
V
I
V
=
≤
= +
>
0
0
0
0 1
0 1
.
.
V
V
(10.7)
Figure 10.9 Current–voltage characteristics of a multiwalled carbon nanotube [2]. The graph,
was calculated using Eq. (10.6) setting α = 0.5and β = 0.25 V
−1 . The characteristic is similar to
that observed for graphene and gold nanowires.
–4
–2
0
2
4
voltage [V]
–500
–250
0
250
500
current
[µA]