

70
T. Rakitskaya et al.
B + HOH ↔ BH
+
+ OH
−
.
(1)
In the case of OMS-2(Ref) and OMS-2(SG) samples, vice versa, suspension pH
values rapidly decrease, and pH s < 0 indicates the establishment of the following
equilibrium:
L + HOH ↔ L − OH + H
+
.
(2)
Thus, either the basic sites (OMS-2(SSt), OMS-2(MS)) or acidic sites (OMS2(Ref), OMS-2(SG)) predominate in the synthesized samples. However, judging
by the pH eq values, the strength of these sites is significantly different. After the
reaction of the OMS-2 samples with ozone, the character of the pH-τ curves and,
consequently, the sign of the suspension effect are retained; however, in all cases,
except for OMS-2(Ref), the pH values decrease, indicating an increase in the number
of Lewis sites with a large positive charge due to the reaction of Mn
3+ with ozone,
i.e., the Mn
3+
→ Mn
4+ transition is realized.
3.6 Testing OMS-2 Samples in Reaction with Ozone
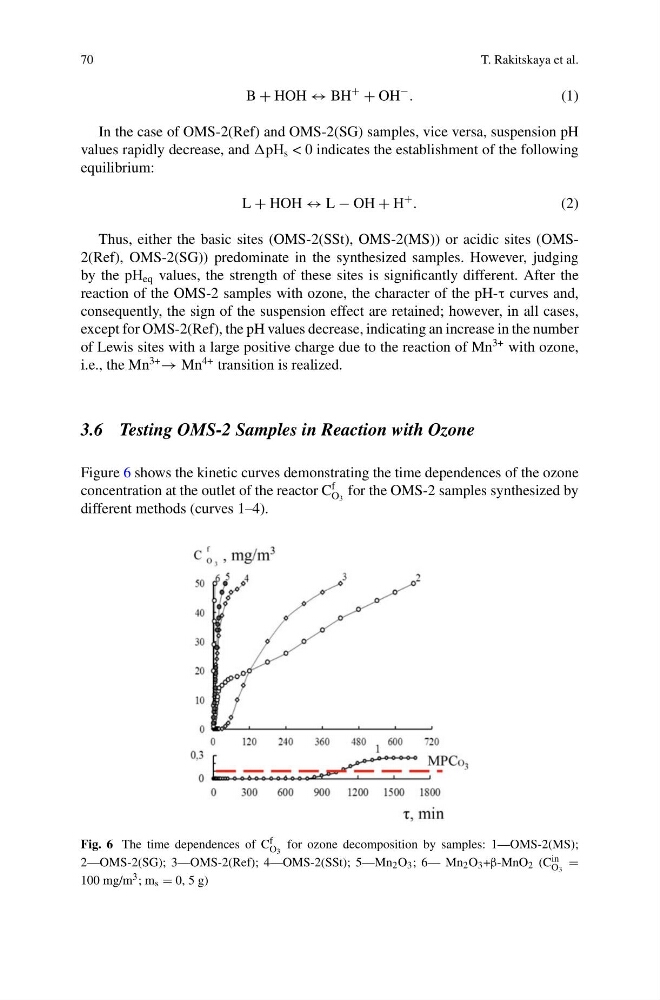
Figure 6 shows the kinetic curves demonstrating the time dependences of the ozone
concentration at the outlet of the reactor C
f
O 3
for the OMS-2 samples synthesized by
different methods (curves 1–4).
Fig. 6 The time dependences of C f
O3 for ozone decomposition by samples: 1—OMS-2(MS);
2—OMS-2(SG); 3—OMS-2(Ref); 4—OMS-2(SSt); 5—Mn 2 O 3 ; 6— Mn 2 O 3 +β-MnO 2 (C in
O3 =
100 mg/m 3 ; m s = 0, 5 g)
T. Rakitskaya et al.
B + HOH ↔ BH
+
+ OH
−
.
(1)
In the case of OMS-2(Ref) and OMS-2(SG) samples, vice versa, suspension pH
values rapidly decrease, and pH s < 0 indicates the establishment of the following
equilibrium:
L + HOH ↔ L − OH + H
+
.
(2)
Thus, either the basic sites (OMS-2(SSt), OMS-2(MS)) or acidic sites (OMS2(Ref), OMS-2(SG)) predominate in the synthesized samples. However, judging
by the pH eq values, the strength of these sites is significantly different. After the
reaction of the OMS-2 samples with ozone, the character of the pH-τ curves and,
consequently, the sign of the suspension effect are retained; however, in all cases,
except for OMS-2(Ref), the pH values decrease, indicating an increase in the number
of Lewis sites with a large positive charge due to the reaction of Mn
3+ with ozone,
i.e., the Mn
3+
→ Mn
4+ transition is realized.
3.6 Testing OMS-2 Samples in Reaction with Ozone
Figure 6 shows the kinetic curves demonstrating the time dependences of the ozone
concentration at the outlet of the reactor C
f
O 3
for the OMS-2 samples synthesized by
different methods (curves 1–4).
Fig. 6 The time dependences of C f
O3 for ozone decomposition by samples: 1—OMS-2(MS);
2—OMS-2(SG); 3—OMS-2(Ref); 4—OMS-2(SSt); 5—Mn 2 O 3 ; 6— Mn 2 O 3 +β-MnO 2 (C in
O3 =
100 mg/m 3 ; m s = 0, 5 g)