

Structural, Morphological, and Catalytic Properties …
67
(a)
( c )
(b)
(d)
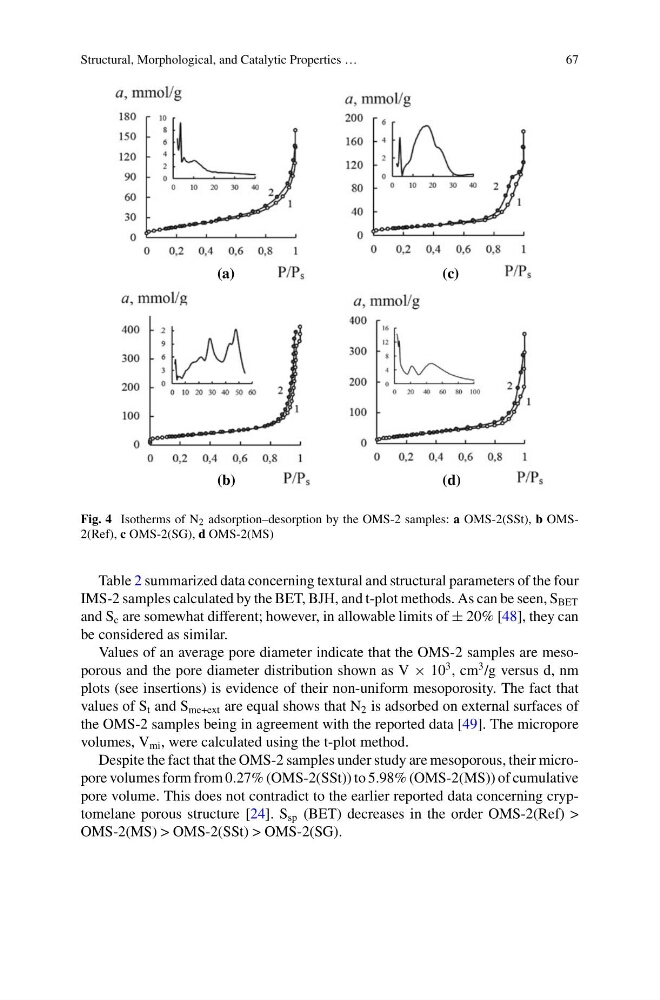
Fig. 4 Isotherms of N 2 adsorption–desorption by the OMS-2 samples: a OMS-2(SSt), b OMS2(Ref), c OMS-2(SG), d OMS-2(MS)
Table 2 summarized data concerning textural and structural parameters of the four
IMS-2 samples calculated by the BET, BJH, and t-plot methods. As can be seen, S BET
and S c are somewhat different; however, in allowable limits of ± 20% [48], they can
be considered as similar.
Values of an average pore diameter indicate that the OMS-2 samples are mesoporous and the pore diameter distribution shown as V × 10
3 , cm
3 /g versus d, nm
plots (see insertions) is evidence of their non-uniform mesoporosity. The fact that
values of S t and S me+ext are equal shows that N 2 is adsorbed on external surfaces of
the OMS-2 samples being in agreement with the reported data [49]. The micropore
volumes, V mi , were calculated using the t-plot method.
Despite the fact that the OMS-2 samples under study are mesoporous, their micropore volumes form from 0.27% (OMS-2(SSt)) to 5.98% (OMS-2(MS)) of cumulative
pore volume. This does not contradict to the earlier reported data concerning cryptomelane porous structure [24]. S sp (BET) decreases in the order OMS-2(Ref) >
OMS-2(MS) > OMS-2(SSt) > OMS-2(SG).
67
(a)
( c )
(b)
(d)
Fig. 4 Isotherms of N 2 adsorption–desorption by the OMS-2 samples: a OMS-2(SSt), b OMS2(Ref), c OMS-2(SG), d OMS-2(MS)
Table 2 summarized data concerning textural and structural parameters of the four
IMS-2 samples calculated by the BET, BJH, and t-plot methods. As can be seen, S BET
and S c are somewhat different; however, in allowable limits of ± 20% [48], they can
be considered as similar.
Values of an average pore diameter indicate that the OMS-2 samples are mesoporous and the pore diameter distribution shown as V × 10
3 , cm
3 /g versus d, nm
plots (see insertions) is evidence of their non-uniform mesoporosity. The fact that
values of S t and S me+ext are equal shows that N 2 is adsorbed on external surfaces of
the OMS-2 samples being in agreement with the reported data [49]. The micropore
volumes, V mi , were calculated using the t-plot method.
Despite the fact that the OMS-2 samples under study are mesoporous, their micropore volumes form from 0.27% (OMS-2(SSt)) to 5.98% (OMS-2(MS)) of cumulative
pore volume. This does not contradict to the earlier reported data concerning cryptomelane porous structure [24]. S sp (BET) decreases in the order OMS-2(Ref) >
OMS-2(MS) > OMS-2(SSt) > OMS-2(SG).