

Structural, Morphological, and Catalytic Properties …
63
– τ MPC is a time of protective action, i.e., a period of time from experiment beginning
during which C
f
O 3
< MPC O 3 ,
– τ 1/2 is a half-conversion time, i.e., a period of time from experiment beginning up
to the moment when C
f
O 3
becomes equal to 0.5 C
in
O 3
,
– Q exp is an experimental amount of O 3 mol, i.e., the amount of ozone entered into
the reaction up to a moment of experiment termination and calculated as an area
under the corresponding ozonogram plotted as a C O 3 versus τ.
3 Results and Discussion
3.1 XRD Analysis
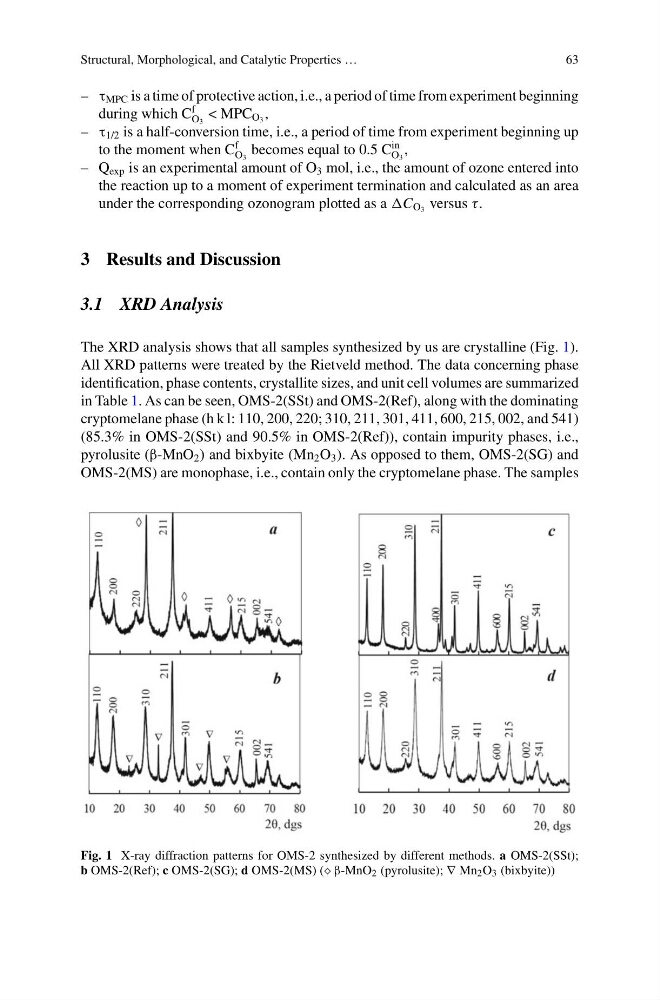
The XRD analysis shows that all samples synthesized by us are crystalline (Fig. 1).
All XRD patterns were treated by the Rietveld method. The data concerning phase
identification, phase contents, crystallite sizes, and unit cell volumes are summarized
in Table 1. As can be seen, OMS-2(SSt) and OMS-2(Ref), along with the dominating
cryptomelane phase (h k l: 110, 200, 220; 310, 211, 301, 411, 600, 215, 002, and 541)
(85.3% in OMS-2(SSt) and 90.5% in OMS-2(Ref)), contain impurity phases, i.e.,
pyrolusite (β-MnO 2 ) and bixbyite (Mn 2 O 3 ). As opposed to them, OMS-2(SG) and
OMS-2(MS) are monophase, i.e., contain only the cryptomelane phase. The samples
Fig. 1 X-ray diffraction patterns for OMS-2 synthesized by different methods. a OMS-2(SSt);
b OMS-2(Ref); c OMS-2(SG); d OMS-2(MS) ( β-MnO 2 (pyrolusite); ∇ Mn 2 O 3 (bixbyite))
63
– τ MPC is a time of protective action, i.e., a period of time from experiment beginning
during which C
f
O 3
< MPC O 3 ,
– τ 1/2 is a half-conversion time, i.e., a period of time from experiment beginning up
to the moment when C
f
O 3
becomes equal to 0.5 C
in
O 3
,
– Q exp is an experimental amount of O 3 mol, i.e., the amount of ozone entered into
the reaction up to a moment of experiment termination and calculated as an area
under the corresponding ozonogram plotted as a C O 3 versus τ.
3 Results and Discussion
3.1 XRD Analysis
The XRD analysis shows that all samples synthesized by us are crystalline (Fig. 1).
All XRD patterns were treated by the Rietveld method. The data concerning phase
identification, phase contents, crystallite sizes, and unit cell volumes are summarized
in Table 1. As can be seen, OMS-2(SSt) and OMS-2(Ref), along with the dominating
cryptomelane phase (h k l: 110, 200, 220; 310, 211, 301, 411, 600, 215, 002, and 541)
(85.3% in OMS-2(SSt) and 90.5% in OMS-2(Ref)), contain impurity phases, i.e.,
pyrolusite (β-MnO 2 ) and bixbyite (Mn 2 O 3 ). As opposed to them, OMS-2(SG) and
OMS-2(MS) are monophase, i.e., contain only the cryptomelane phase. The samples
Fig. 1 X-ray diffraction patterns for OMS-2 synthesized by different methods. a OMS-2(SSt);
b OMS-2(Ref); c OMS-2(SG); d OMS-2(MS) ( β-MnO 2 (pyrolusite); ∇ Mn 2 O 3 (bixbyite))