

Synthesis of HA–Collagen and HA–Collagen–Alginate Nanocomposites
713
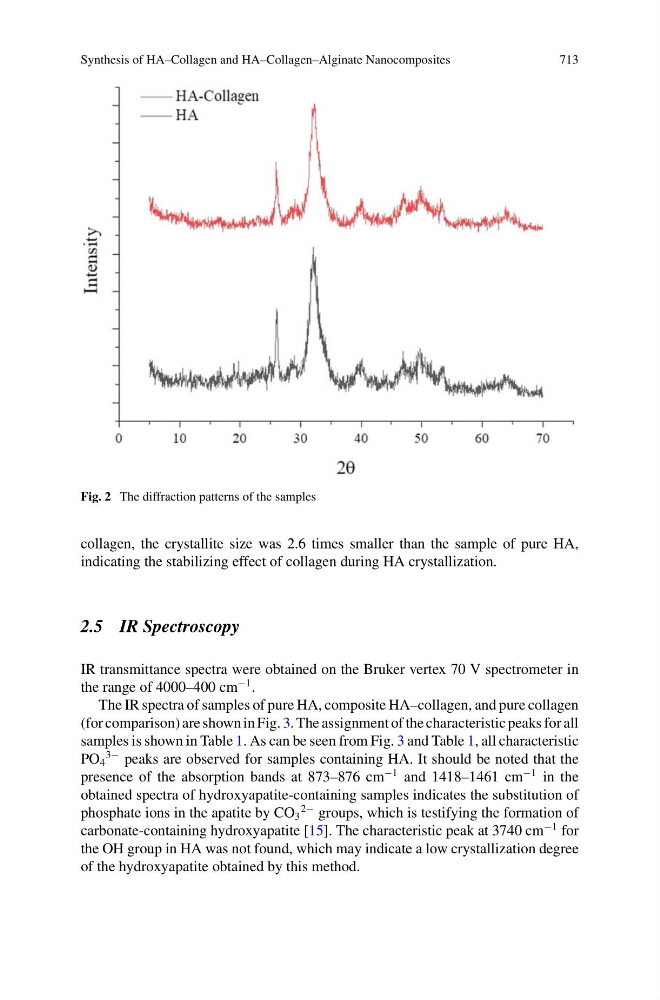
Fig. 2 The diffraction patterns of the samples
collagen, the crystallite size was 2.6 times smaller than the sample of pure HA,
indicating the stabilizing effect of collagen during HA crystallization.
2.5 IR Spectroscopy
IR transmittance spectra were obtained on the Bruker vertex 70 V spectrometer in
the range of 4000–400 cm
−1 .
The IR spectra of samples of pure HA, composite HA–collagen, and pure collagen
(for comparison) are shown in Fig. 3. The assignment of the characteristic peaks for all
samples is shown in Table 1. As can be seen from Fig. 3 and Table 1, all characteristic
PO 4
3− peaks are observed for samples containing HA. It should be noted that the
presence of the absorption bands at 873–876 cm
−1 and 1418–1461 cm
−1 in the
obtained spectra of hydroxyapatite-containing samples indicates the substitution of
phosphate ions in the apatite by CO 3
2− groups, which is testifying the formation of
carbonate-containing hydroxyapatite [15]. The characteristic peak at 3740 cm
−1 for
the OH group in HA was not found, which may indicate a low crystallization degree
of the hydroxyapatite obtained by this method.