

Influence of the Carbon Allotropes on Dilatometric Properties …
663
(3), the so-called Turner formula [49]) can only increase the speed of the indicated
temperature changes. Existence of more than two components in the composite can
lead to complication of temperature dependencies, in general. The result obtained
leads us to the conclusion that in the temperature range of 575–800 °C the expansion
behavior, L/L 0 , for the Fe–Cu composite can be mainly due to the manifestation of
a phase transformation of two components of the composite, at least. The behavior
of the L/L 0 curve for the Fe–Cu sample in the ranges 150–250 and 650–750 °C can
also be the consequence of such transformations. (This question will be discussed
below.) Thus, the increase of CTE for Fe–Cu sample with temperature increasing in
the ranges 150–275 and 575–690 °C both as CTE decreases with further temperature increasing, as well as the corresponding temperature changes of these samples
length, L/L 0 , (Fig. 12) can be due to transformations of their phase composition.
The answer which phase components are involved in these and other transformations
of the structure of the sample we derived from studies of their composition, structure and morphology. To do this, we used procedures such as infrared absorption
(scattering) of light, XRD, and Raman scattering.
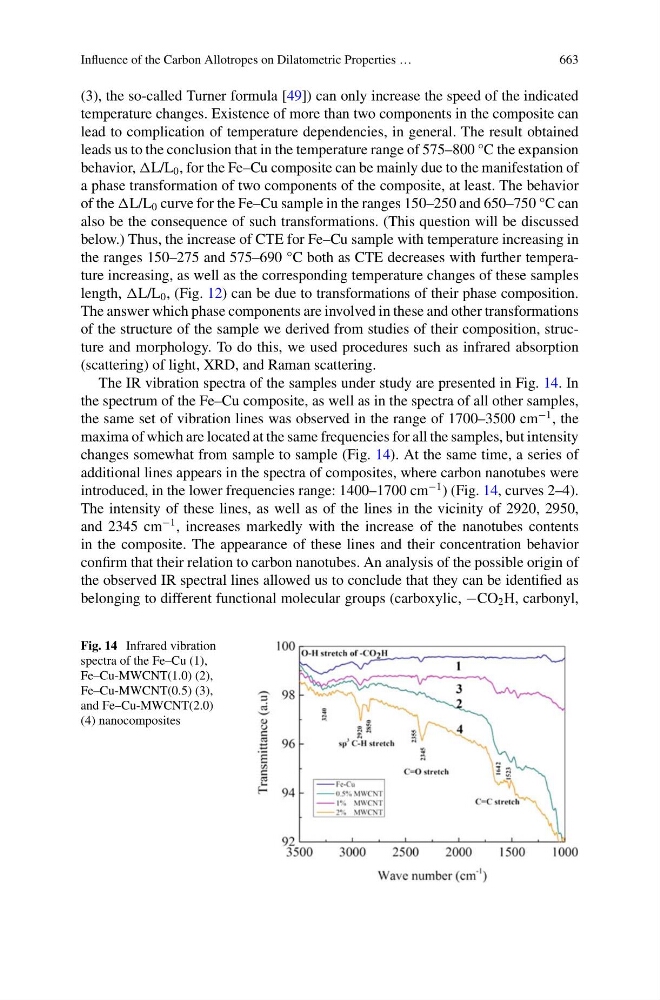
The IR vibration spectra of the samples under study are presented in Fig. 14. In
the spectrum of the Fe–Cu composite, as well as in the spectra of all other samples,
the same set of vibration lines was observed in the range of 1700–3500 cm
−1 , the
maxima of which are located at the same frequencies for all the samples, but intensity
changes somewhat from sample to sample (Fig. 14). At the same time, a series of
additional lines appears in the spectra of composites, where carbon nanotubes were
introduced, in the lower frequencies range: 1400–1700 cm
−1 ) (Fig. 14, curves 2–4).
The intensity of these lines, as well as of the lines in the vicinity of 2920, 2950,
and 2345 cm
−1 , increases markedly with the increase of the nanotubes contents
in the composite. The appearance of these lines and their concentration behavior
confirm that their relation to carbon nanotubes. An analysis of the possible origin of
the observed IR spectral lines allowed us to conclude that they can be identified as
belonging to different functional molecular groups (carboxylic, −CO 2 H, carbonyl,
Fig. 14 Infrared vibration
spectra of the Fe–Cu (1),
Fe–Cu-MWCNT(1.0) (2),
Fe–Cu-MWCNT(0.5) (3),
and Fe–Cu-MWCNT(2.0)
(4) nanocomposites