

Structure and Properties of the POSS-Containing Nanocomposites …
501
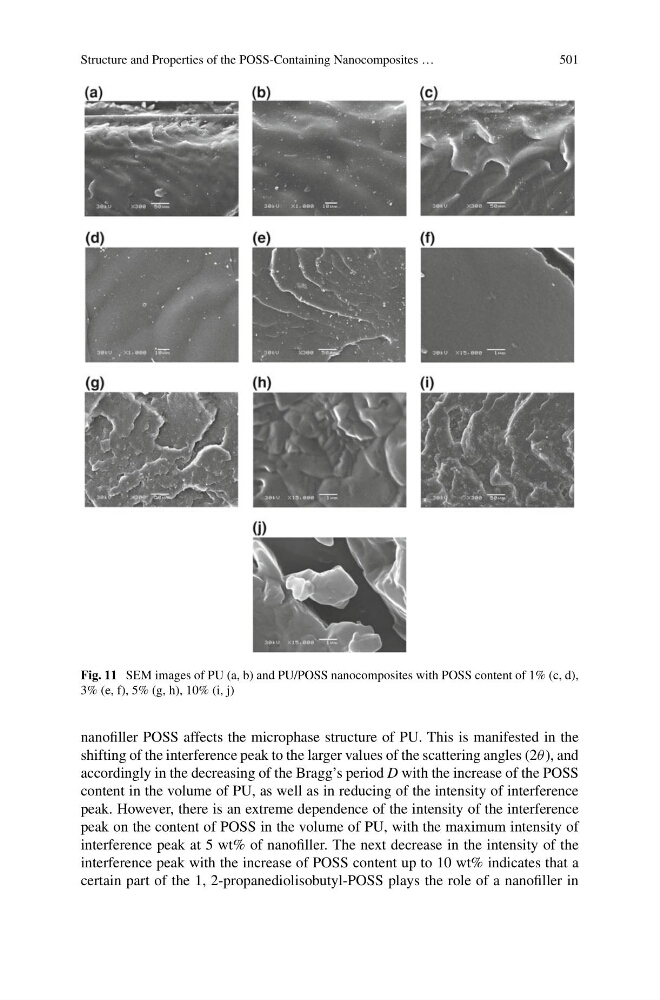
Fig. 11 SEM images of PU (a, b) and PU/POSS nanocomposites with POSS content of 1% (c, d),
3% (e, f), 5% (g, h), 10% (i, j)
nanofiller POSS affects the microphase structure of PU. This is manifested in the
shifting of the interference peak to the larger values of the scattering angles (2θ ), and
accordingly in the decreasing of the Bragg’s period D with the increase of the POSS
content in the volume of PU, as well as in reducing of the intensity of interference
peak. However, there is an extreme dependence of the intensity of the interference
peak on the content of POSS in the volume of PU, with the maximum intensity of
interference peak at 5 wt% of nanofiller. The next decrease in the intensity of the
interference peak with the increase of POSS content up to 10 wt% indicates that a
certain part of the 1, 2-propanediolisobutyl-POSS plays the role of a nanofiller in
501
Fig. 11 SEM images of PU (a, b) and PU/POSS nanocomposites with POSS content of 1% (c, d),
3% (e, f), 5% (g, h), 10% (i, j)
nanofiller POSS affects the microphase structure of PU. This is manifested in the
shifting of the interference peak to the larger values of the scattering angles (2θ ), and
accordingly in the decreasing of the Bragg’s period D with the increase of the POSS
content in the volume of PU, as well as in reducing of the intensity of interference
peak. However, there is an extreme dependence of the intensity of the interference
peak on the content of POSS in the volume of PU, with the maximum intensity of
interference peak at 5 wt% of nanofiller. The next decrease in the intensity of the
interference peak with the increase of POSS content up to 10 wt% indicates that a
certain part of the 1, 2-propanediolisobutyl-POSS plays the role of a nanofiller in