

428
A. V. Dvornichenko and O. M. Shchokotova
2 Phase-Field Model of Epitaxial Growth
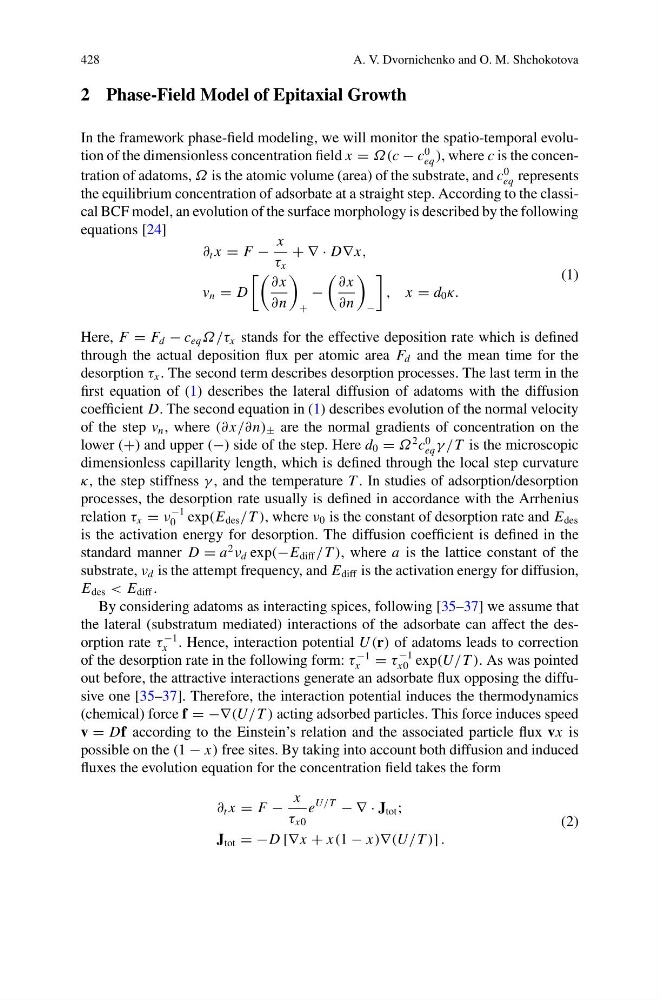
In the framework phase-field modeling, we will monitor the spatio-temporal evolution of the dimensionless concentration field x = Ω(c − c
0
eq ), where c is the concentration of adatoms, Ω is the atomic volume (area) of the substrate, and c
0
eq represents
the equilibrium concentration of adsorbate at a straight step. According to the classical BCF model, an evolution of the surface morphology is described by the following
equations [24]
∂ t x = F −
x
τ x
+ ∇ · D∇x,
v n = D
∂ x
∂n
+
−
∂ x
∂n
−
, x = d 0 κ.
(1)
Here, F = F d − c eq Ω/τ x stands for the effective deposition rate which is defined
through the actual deposition flux per atomic area F d and the mean time for the
desorption τ x . The second term describes desorption processes. The last term in the
first equation of (1) describes the lateral diffusion of adatoms with the diffusion
coefficient D. The second equation in (1) describes evolution of the normal velocity
of the step v n , where (∂ x/∂n) ± are the normal gradients of concentration on the
lower (+) and upper (−) side of the step. Here d 0 = Ω
2 c
0
eq γ /T is the microscopic
dimensionless capillarity length, which is defined through the local step curvature
κ, the step stiffness γ , and the temperature T . In studies of adsorption/desorption
processes, the desorption rate usually is defined in accordance with the Arrhenius
relation τ x = ν
−1
0 exp(E des /T ), where ν 0 is the constant of desorption rate and E des
is the activation energy for desorption. The diffusion coefficient is defined in the
standard manner D = a
2
ν d exp(−E diff /T ), where a is the lattice constant of the
substrate, ν d is the attempt frequency, and E diff is the activation energy for diffusion,
E des < E diff .
By considering adatoms as interacting spices, following [35–37] we assume that
the lateral (substratum mediated) interactions of the adsorbate can affect the desorption rate τ
−1
x . Hence, interaction potential U (r) of adatoms leads to correction
of the desorption rate in the following form: τ
−1
x = τ
−1
x0 exp(U/T ). As was pointed
out before, the attractive interactions generate an adsorbate flux opposing the diffusive one [35–37]. Therefore, the interaction potential induces the thermodynamics
(chemical) force f = −∇(U/T ) acting adsorbed particles. This force induces speed
v = Df according to the Einstein’s relation and the associated particle flux vx is
possible on the (1 − x) free sites. By taking into account both diffusion and induced
fluxes the evolution equation for the concentration field takes the form
∂ t x = F −
x
τ x0
e
U/T
− ∇ · J tot ;
J tot = −D [∇x + x(1 − x)∇(U/T )] .
(2)
A. V. Dvornichenko and O. M. Shchokotova
2 Phase-Field Model of Epitaxial Growth
In the framework phase-field modeling, we will monitor the spatio-temporal evolution of the dimensionless concentration field x = Ω(c − c
0
eq ), where c is the concentration of adatoms, Ω is the atomic volume (area) of the substrate, and c
0
eq represents
the equilibrium concentration of adsorbate at a straight step. According to the classical BCF model, an evolution of the surface morphology is described by the following
equations [24]
∂ t x = F −
x
τ x
+ ∇ · D∇x,
v n = D
∂ x
∂n
+
−
∂ x
∂n
−
, x = d 0 κ.
(1)
Here, F = F d − c eq Ω/τ x stands for the effective deposition rate which is defined
through the actual deposition flux per atomic area F d and the mean time for the
desorption τ x . The second term describes desorption processes. The last term in the
first equation of (1) describes the lateral diffusion of adatoms with the diffusion
coefficient D. The second equation in (1) describes evolution of the normal velocity
of the step v n , where (∂ x/∂n) ± are the normal gradients of concentration on the
lower (+) and upper (−) side of the step. Here d 0 = Ω
2 c
0
eq γ /T is the microscopic
dimensionless capillarity length, which is defined through the local step curvature
κ, the step stiffness γ , and the temperature T . In studies of adsorption/desorption
processes, the desorption rate usually is defined in accordance with the Arrhenius
relation τ x = ν
−1
0 exp(E des /T ), where ν 0 is the constant of desorption rate and E des
is the activation energy for desorption. The diffusion coefficient is defined in the
standard manner D = a
2
ν d exp(−E diff /T ), where a is the lattice constant of the
substrate, ν d is the attempt frequency, and E diff is the activation energy for diffusion,
E des < E diff .
By considering adatoms as interacting spices, following [35–37] we assume that
the lateral (substratum mediated) interactions of the adsorbate can affect the desorption rate τ
−1
x . Hence, interaction potential U (r) of adatoms leads to correction
of the desorption rate in the following form: τ
−1
x = τ
−1
x0 exp(U/T ). As was pointed
out before, the attractive interactions generate an adsorbate flux opposing the diffusive one [35–37]. Therefore, the interaction potential induces the thermodynamics
(chemical) force f = −∇(U/T ) acting adsorbed particles. This force induces speed
v = Df according to the Einstein’s relation and the associated particle flux vx is
possible on the (1 − x) free sites. By taking into account both diffusion and induced
fluxes the evolution equation for the concentration field takes the form
∂ t x = F −
x
τ x0
e
U/T
− ∇ · J tot ;
J tot = −D [∇x + x(1 − x)∇(U/T )] .
(2)