

Features of Phase Formation Processes in Amorphous Alloys …
421
-0.6
-0.5
-0.4
-0.3
-0.2
-0.1
0
500
1000
1500
2000
2500
3000
3500
-0.5
-0.4
-0.3
-0.2
-0.1
500
1000
1500
2000
2500
3000
3500
-0.5
-0.4
-0.3
-0.2
-0.1
500
1000
1500
2000
2500
3000
3500
T= 600 K
E, Ha
E F
T= 450 K
n(E),
st/Ha/cell
E F
E F
(c)
(b)
(a)
T= 300 K
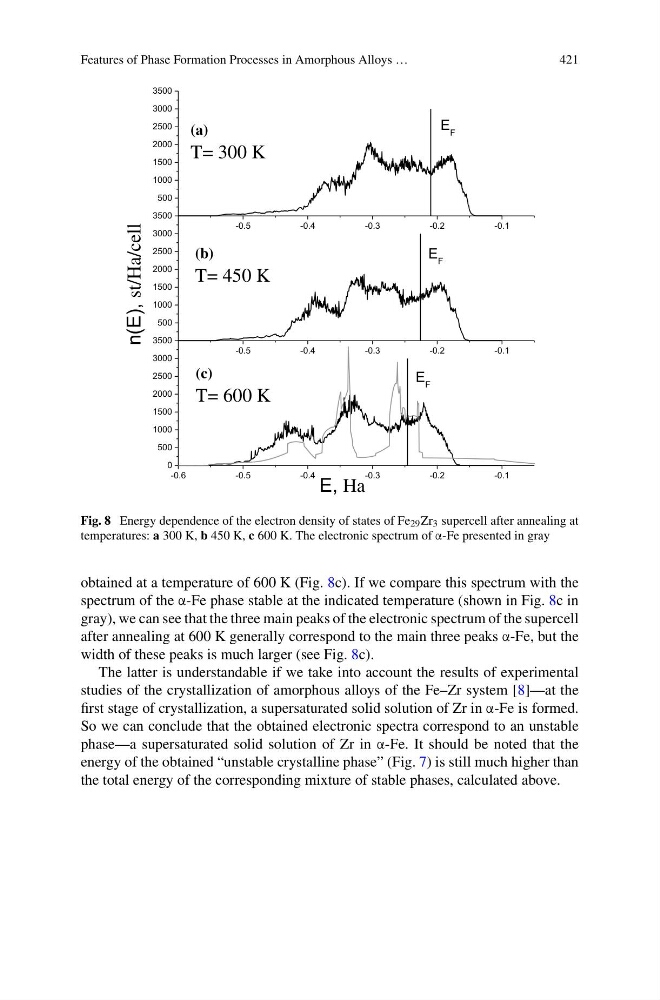
Fig. 8 Energy dependence of the electron density of states of Fe 29 Zr 3 supercell after annealing at
temperatures: a 300 K, b 450 K, c 600 K. The electronic spectrum of α-Fe presented in gray
obtained at a temperature of 600 K (Fig. 8c). If we compare this spectrum with the
spectrum of the α-Fe phase stable at the indicated temperature (shown in Fig. 8c in
gray), we can see that the three main peaks of the electronic spectrum of the supercell
after annealing at 600 K generally correspond to the main three peaks α-Fe, but the
width of these peaks is much larger (see Fig. 8c).
The latter is understandable if we take into account the results of experimental
studies of the crystallization of amorphous alloys of the Fe–Zr system [8]—at the
first stage of crystallization, a supersaturated solid solution of Zr in α-Fe is formed.
So we can conclude that the obtained electronic spectra correspond to an unstable
phase—a supersaturated solid solution of Zr in α-Fe. It should be noted that the
energy of the obtained “unstable crystalline phase” (Fig. 7) is still much higher than
the total energy of the corresponding mixture of stable phases, calculated above.
421
-0.6
-0.5
-0.4
-0.3
-0.2
-0.1
0
500
1000
1500
2000
2500
3000
3500
-0.5
-0.4
-0.3
-0.2
-0.1
500
1000
1500
2000
2500
3000
3500
-0.5
-0.4
-0.3
-0.2
-0.1
500
1000
1500
2000
2500
3000
3500
T= 600 K
E, Ha
E F
T= 450 K
n(E),
st/Ha/cell
E F
E F
(c)
(b)
(a)
T= 300 K
Fig. 8 Energy dependence of the electron density of states of Fe 29 Zr 3 supercell after annealing at
temperatures: a 300 K, b 450 K, c 600 K. The electronic spectrum of α-Fe presented in gray
obtained at a temperature of 600 K (Fig. 8c). If we compare this spectrum with the
spectrum of the α-Fe phase stable at the indicated temperature (shown in Fig. 8c in
gray), we can see that the three main peaks of the electronic spectrum of the supercell
after annealing at 600 K generally correspond to the main three peaks α-Fe, but the
width of these peaks is much larger (see Fig. 8c).
The latter is understandable if we take into account the results of experimental
studies of the crystallization of amorphous alloys of the Fe–Zr system [8]—at the
first stage of crystallization, a supersaturated solid solution of Zr in α-Fe is formed.
So we can conclude that the obtained electronic spectra correspond to an unstable
phase—a supersaturated solid solution of Zr in α-Fe. It should be noted that the
energy of the obtained “unstable crystalline phase” (Fig. 7) is still much higher than
the total energy of the corresponding mixture of stable phases, calculated above.