

Ising-Like Model of Nanosize Spin-Crossover Molecular Crystals
149
(a)
(b)
(c)
(d)
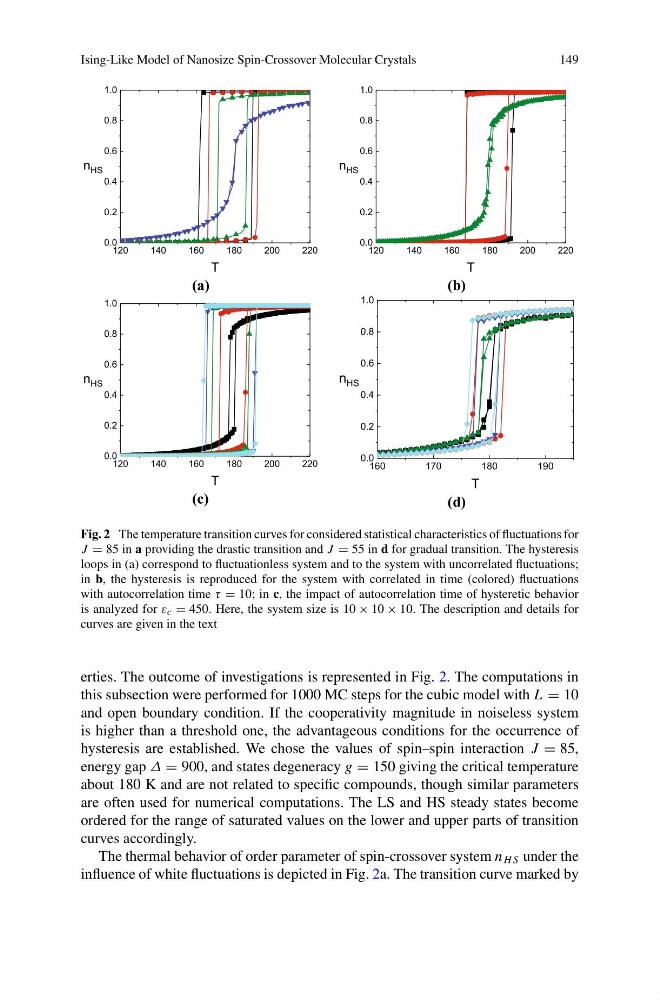
Fig. 2 The temperature transition curves for considered statistical characteristics of fluctuations for
J = 85 in a providing the drastic transition and J = 55 in d for gradual transition. The hysteresis
loops in (a) correspond to fluctuationless system and to the system with uncorrelated fluctuations;
in b, the hysteresis is reproduced for the system with correlated in time (colored) fluctuations
with autocorrelation time τ = 10; in c, the impact of autocorrelation time of hysteretic behavior
is analyzed for ε c = 450. Here, the system size is 10 × 10 × 10. The description and details for
curves are given in the text
erties. The outcome of investigations is represented in Fig. 2. The computations in
this subsection were performed for 1000 MC steps for the cubic model with L = 10
and open boundary condition. If the cooperativity magnitude in noiseless system
is higher than a threshold one, the advantageous conditions for the occurrence of
hysteresis are established. We chose the values of spin–spin interaction J = 85,
energy gap Δ = 900, and states degeneracy g = 150 giving the critical temperature
about 180 K and are not related to specific compounds, though similar parameters
are often used for numerical computations. The LS and HS steady states become
ordered for the range of saturated values on the lower and upper parts of transition
curves accordingly.
The thermal behavior of order parameter of spin-crossover system n H S under the
influence of white fluctuations is depicted in Fig. 2a. The transition curve marked by
149
(a)
(b)
(c)
(d)
Fig. 2 The temperature transition curves for considered statistical characteristics of fluctuations for
J = 85 in a providing the drastic transition and J = 55 in d for gradual transition. The hysteresis
loops in (a) correspond to fluctuationless system and to the system with uncorrelated fluctuations;
in b, the hysteresis is reproduced for the system with correlated in time (colored) fluctuations
with autocorrelation time τ = 10; in c, the impact of autocorrelation time of hysteretic behavior
is analyzed for ε c = 450. Here, the system size is 10 × 10 × 10. The description and details for
curves are given in the text
erties. The outcome of investigations is represented in Fig. 2. The computations in
this subsection were performed for 1000 MC steps for the cubic model with L = 10
and open boundary condition. If the cooperativity magnitude in noiseless system
is higher than a threshold one, the advantageous conditions for the occurrence of
hysteresis are established. We chose the values of spin–spin interaction J = 85,
energy gap Δ = 900, and states degeneracy g = 150 giving the critical temperature
about 180 K and are not related to specific compounds, though similar parameters
are often used for numerical computations. The LS and HS steady states become
ordered for the range of saturated values on the lower and upper parts of transition
curves accordingly.
The thermal behavior of order parameter of spin-crossover system n H S under the
influence of white fluctuations is depicted in Fig. 2a. The transition curve marked by