

26 Bifunctional Silicas with Immobilized Lignin
421
a
-100
0
100
200
300
400
coolin g 3
coolin g 2
hea ting 2
325
255
180
Heat flow (Endo up)
110
o
C
0.5 W/g
20 K/min
pure Lignin
h e a ti n g 1
Temperature,
o
C
Temperature,
o
C
b
Heat flow (Endo UP)
-50
50
150
250
350
3rd heat
2nd heat
322
185
255
Sample 1
Sample 2
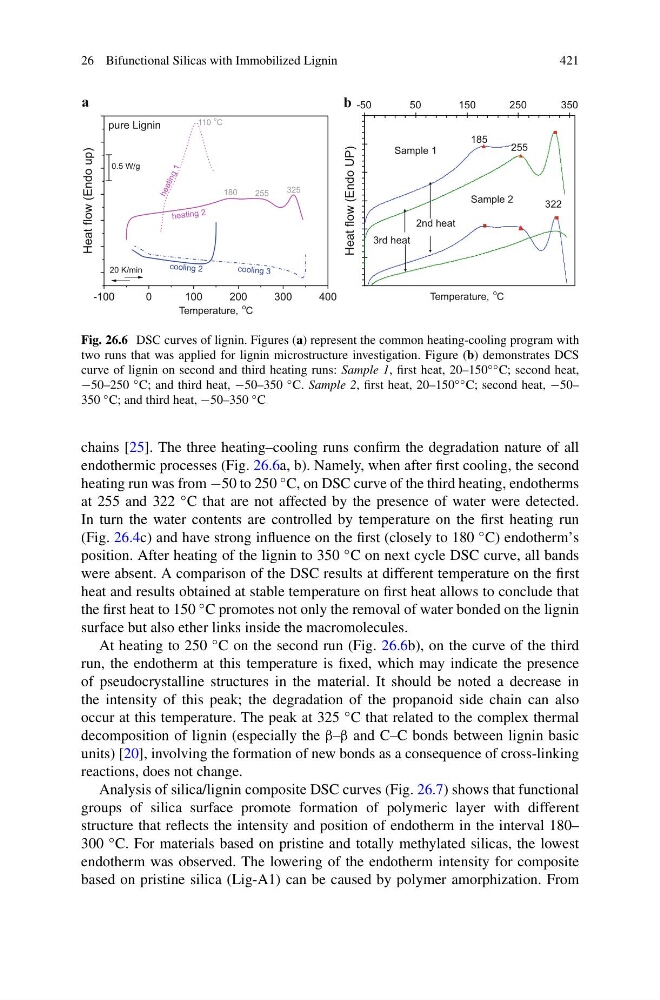
Fig. 26.6 DSC curves of lignin. Figures (a) represent the common heating-cooling program with
two runs that was applied for lignin microstructure investigation. Figure (b) demonstrates DCS
curve of lignin on second and third heating runs: Sample 1, first heat, 20–150 ◦◦ C; second heat,
−50–250 ◦ C; and third heat, −50–350 ◦ C. Sample 2, first heat, 20–150 ◦◦ C; second heat, −50–
350 ◦ C; and third heat, −50–350 ◦ C
chains [25]. The three heating–cooling runs confirm the degradation nature of all
endothermic processes (Fig. 26.6a, b). Namely, when after first cooling, the second
heating run was from −50 to 250 ◦ C, on DSC curve of the third heating, endotherms
at 255 and 322 ◦ C that are not affected by the presence of water were detected.
In turn the water contents are controlled by temperature on the first heating run
(Fig. 26.4c) and have strong influence on the first (closely to 180 ◦ C) endotherm’s
position. After heating of the lignin to 350 ◦ C on next cycle DSC curve, all bands
were absent. A comparison of the DSC results at different temperature on the first
heat and results obtained at stable temperature on first heat allows to conclude that
the first heat to 150 ◦ C promotes not only the removal of water bonded on the lignin
surface but also ether links inside the macromolecules.
At heating to 250 ◦ C on the second run (Fig. 26.6b), on the curve of the third
run, the endotherm at this temperature is fixed, which may indicate the presence
of pseudocrystalline structures in the material. It should be noted a decrease in
the intensity of this peak; the degradation of the propanoid side chain can also
occur at this temperature. The peak at 325 ◦ C that related to the complex thermal
decomposition of lignin (especially the β–β and C–C bonds between lignin basic
units) [20], involving the formation of new bonds as a consequence of cross-linking
reactions, does not change.
Analysis of silica/lignin composite DSC curves (Fig. 26.7) shows that functional
groups of silica surface promote formation of polymeric layer with different
structure that reflects the intensity and position of endotherm in the interval 180–
300 ◦ C. For materials based on pristine and totally methylated silicas, the lowest
endotherm was observed. The lowering of the endotherm intensity for composite
based on pristine silica (Lig-A1) can be caused by polymer amorphization. From
421
a
-100
0
100
200
300
400
coolin g 3
coolin g 2
hea ting 2
325
255
180
Heat flow (Endo up)
110
o
C
0.5 W/g
20 K/min
pure Lignin
h e a ti n g 1
Temperature,
o
C
Temperature,
o
C
b
Heat flow (Endo UP)
-50
50
150
250
350
3rd heat
2nd heat
322
185
255
Sample 1
Sample 2
Fig. 26.6 DSC curves of lignin. Figures (a) represent the common heating-cooling program with
two runs that was applied for lignin microstructure investigation. Figure (b) demonstrates DCS
curve of lignin on second and third heating runs: Sample 1, first heat, 20–150 ◦◦ C; second heat,
−50–250 ◦ C; and third heat, −50–350 ◦ C. Sample 2, first heat, 20–150 ◦◦ C; second heat, −50–
350 ◦ C; and third heat, −50–350 ◦ C
chains [25]. The three heating–cooling runs confirm the degradation nature of all
endothermic processes (Fig. 26.6a, b). Namely, when after first cooling, the second
heating run was from −50 to 250 ◦ C, on DSC curve of the third heating, endotherms
at 255 and 322 ◦ C that are not affected by the presence of water were detected.
In turn the water contents are controlled by temperature on the first heating run
(Fig. 26.4c) and have strong influence on the first (closely to 180 ◦ C) endotherm’s
position. After heating of the lignin to 350 ◦ C on next cycle DSC curve, all bands
were absent. A comparison of the DSC results at different temperature on the first
heat and results obtained at stable temperature on first heat allows to conclude that
the first heat to 150 ◦ C promotes not only the removal of water bonded on the lignin
surface but also ether links inside the macromolecules.
At heating to 250 ◦ C on the second run (Fig. 26.6b), on the curve of the third
run, the endotherm at this temperature is fixed, which may indicate the presence
of pseudocrystalline structures in the material. It should be noted a decrease in
the intensity of this peak; the degradation of the propanoid side chain can also
occur at this temperature. The peak at 325 ◦ C that related to the complex thermal
decomposition of lignin (especially the β–β and C–C bonds between lignin basic
units) [20], involving the formation of new bonds as a consequence of cross-linking
reactions, does not change.
Analysis of silica/lignin composite DSC curves (Fig. 26.7) shows that functional
groups of silica surface promote formation of polymeric layer with different
structure that reflects the intensity and position of endotherm in the interval 180–
300 ◦ C. For materials based on pristine and totally methylated silicas, the lowest
endotherm was observed. The lowering of the endotherm intensity for composite
based on pristine silica (Lig-A1) can be caused by polymer amorphization. From