

26 Bifunctional Silicas with Immobilized Lignin
413
a
400
1400
2400
3400
Wavenumber, cm -1
3745
2970
2930
2865
2260
1630
1643
1560
1
2
3
4
5
3648
1126
820
980
990
b
400
1400
2400
3400
Wavenumber, cm -1
Absorbance, %
462
1093
3409
3350
2930
2837
1580
790
1
2
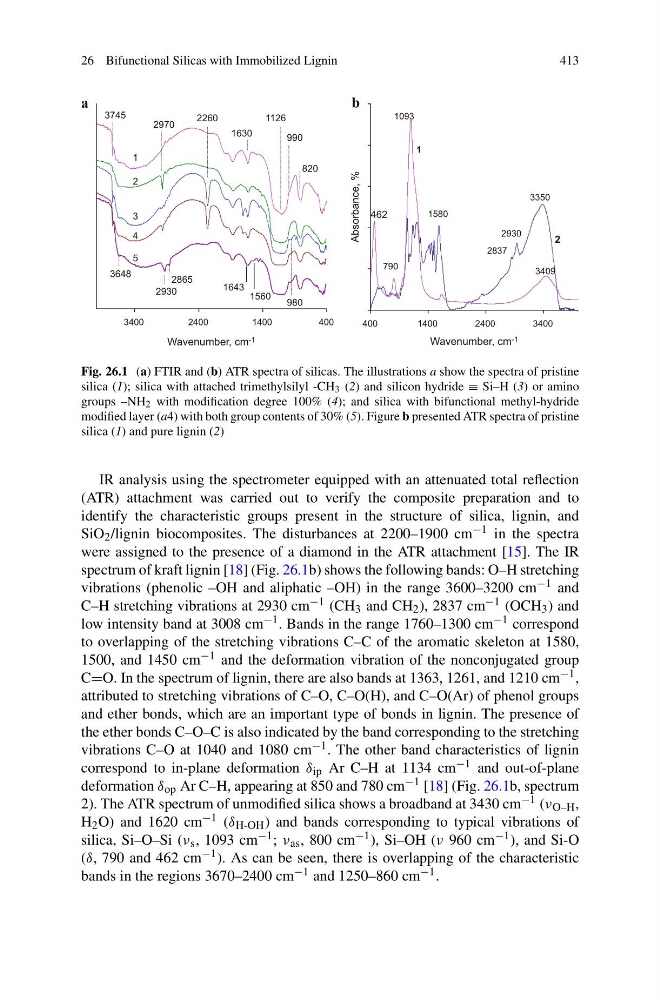
Fig. 26.1 (a) FTIR and (b) ATR spectra of silicas. The illustrations a show the spectra of pristine
silica (1); silica with attached trimethylsilyl -CH 3 (2) and silicon hydride ≡ Si–H (3) or amino
groups –NH 2 with modification degree 100% (4); and silica with bifunctional methyl-hydride
modified layer (a4) with both group contents of 30% (5). Figure b presented ATR spectra of pristine
silica (1) and pure lignin (2)
IR analysis using the spectrometer equipped with an attenuated total reflection
(ATR) attachment was carried out to verify the composite preparation and to
identify the characteristic groups present in the structure of silica, lignin, and
SiO 2 /lignin biocomposites. The disturbances at 2200–1900 cm −1 in the spectra
were assigned to the presence of a diamond in the ATR attachment [15]. The IR
spectrum of kraft lignin [18] (Fig. 26.1b) shows the following bands: O–H stretching
vibrations (phenolic –OH and aliphatic –OH) in the range 3600–3200 cm −1 and
C–H stretching vibrations at 2930 cm −1 (CH 3 and CH 2 ), 2837 cm −1 (OCH 3 ) and
low intensity band at 3008 cm −1 . Bands in the range 1760–1300 cm −1 correspond
to overlapping of the stretching vibrations C–C of the aromatic skeleton at 1580,
1500, and 1450 cm −1 and the deformation vibration of the nonconjugated group
C=O. In the spectrum of lignin, there are also bands at 1363, 1261, and 1210 cm −1 ,
attributed to stretching vibrations of C–O, C–O(H), and C–O(Ar) of phenol groups
and ether bonds, which are an important type of bonds in lignin. The presence of
the ether bonds C–O–C is also indicated by the band corresponding to the stretching
vibrations C–O at 1040 and 1080 cm −1 . The other band characteristics of lignin
correspond to in-plane deformation δ ip Ar C–H at 1134 cm −1 and out-of-plane
deformation δ op Ar C–H, appearing at 850 and 780 cm −1 [18] (Fig. 26.1b, spectrum
2). The ATR spectrum of unmodified silica shows a broadband at 3430 cm −1 (ν O–H ,
H 2 O) and 1620 cm −1 (δ H-OH ) and bands corresponding to typical vibrations of
silica, Si–O–Si (ν s , 1093 cm −1 ; ν as , 800 cm −1 ), Si–OH (ν 960 cm −1 ), and Si-O
(δ, 790 and 462 cm −1 ). As can be seen, there is overlapping of the characteristic
bands in the regions 3670–2400 cm −1 and 1250–860 cm −1 .
413
a
400
1400
2400
3400
Wavenumber, cm -1
3745
2970
2930
2865
2260
1630
1643
1560
1
2
3
4
5
3648
1126
820
980
990
b
400
1400
2400
3400
Wavenumber, cm -1
Absorbance, %
462
1093
3409
3350
2930
2837
1580
790
1
2
Fig. 26.1 (a) FTIR and (b) ATR spectra of silicas. The illustrations a show the spectra of pristine
silica (1); silica with attached trimethylsilyl -CH 3 (2) and silicon hydride ≡ Si–H (3) or amino
groups –NH 2 with modification degree 100% (4); and silica with bifunctional methyl-hydride
modified layer (a4) with both group contents of 30% (5). Figure b presented ATR spectra of pristine
silica (1) and pure lignin (2)
IR analysis using the spectrometer equipped with an attenuated total reflection
(ATR) attachment was carried out to verify the composite preparation and to
identify the characteristic groups present in the structure of silica, lignin, and
SiO 2 /lignin biocomposites. The disturbances at 2200–1900 cm −1 in the spectra
were assigned to the presence of a diamond in the ATR attachment [15]. The IR
spectrum of kraft lignin [18] (Fig. 26.1b) shows the following bands: O–H stretching
vibrations (phenolic –OH and aliphatic –OH) in the range 3600–3200 cm −1 and
C–H stretching vibrations at 2930 cm −1 (CH 3 and CH 2 ), 2837 cm −1 (OCH 3 ) and
low intensity band at 3008 cm −1 . Bands in the range 1760–1300 cm −1 correspond
to overlapping of the stretching vibrations C–C of the aromatic skeleton at 1580,
1500, and 1450 cm −1 and the deformation vibration of the nonconjugated group
C=O. In the spectrum of lignin, there are also bands at 1363, 1261, and 1210 cm −1 ,
attributed to stretching vibrations of C–O, C–O(H), and C–O(Ar) of phenol groups
and ether bonds, which are an important type of bonds in lignin. The presence of
the ether bonds C–O–C is also indicated by the band corresponding to the stretching
vibrations C–O at 1040 and 1080 cm −1 . The other band characteristics of lignin
correspond to in-plane deformation δ ip Ar C–H at 1134 cm −1 and out-of-plane
deformation δ op Ar C–H, appearing at 850 and 780 cm −1 [18] (Fig. 26.1b, spectrum
2). The ATR spectrum of unmodified silica shows a broadband at 3430 cm −1 (ν O–H ,
H 2 O) and 1620 cm −1 (δ H-OH ) and bands corresponding to typical vibrations of
silica, Si–O–Si (ν s , 1093 cm −1 ; ν as , 800 cm −1 ), Si–OH (ν 960 cm −1 ), and Si-O
(δ, 790 and 462 cm −1 ). As can be seen, there is overlapping of the characteristic
bands in the regions 3670–2400 cm −1 and 1250–860 cm −1 .