

18
M. V. Ved’ et al.
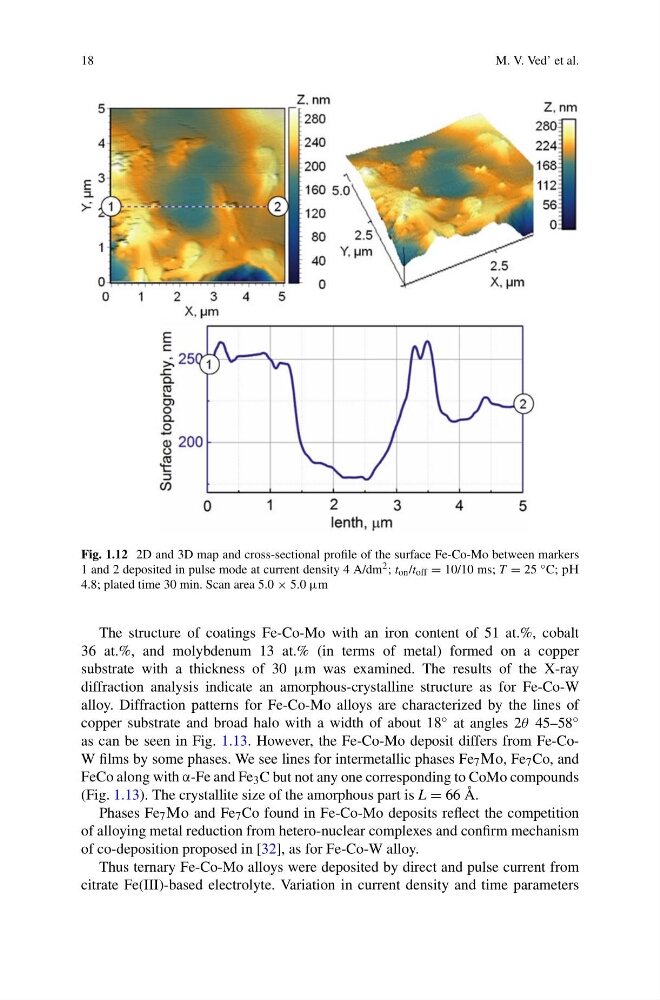
Fig. 1.12 2D and 3D map and cross-sectional profile of the surface Fe-Co-Mo between markers
1 and 2 deposited in pulse mode at current density 4 A/dm 2 ; t on /t off = 10/10 ms; T = 25 ◦ C; Ó°
4.8; plated time 30 min. Scan area 5.0 × 5.0 μm
The structure of coatings Fe-Co-Mo with an iron content of 51 at.%, cobalt
36 at.%, and molybdenum 13 at.% (in terms of metal) formed on a copper
substrate with a thickness of 30 μm was examined. The results of the X-ray
diffraction analysis indicate an amorphous-crystalline structure as for Fe-Co-W
alloy. Diffraction patterns for Fe-Co-Mo alloys are characterized by the lines of
copper substrate and broad halo with a width of about 18 ◦ at angles 2θ 45–58 ◦
as can be seen in Fig. 1.13. However, the Fe-Co-Mo deposit differs from Fe-CoW films by some phases. We see lines for intermetallic phases Fe 7 ¯Ñ, Fe 7 Co, and
FeCo along with α-Fe and Fe 3 C but not any one corresponding to CoMo compounds
(Fig. 1.13). The crystallite size of the amorphous part is L = 66 Å.
Phases Fe 7 ¯Ñ and Fe 7 Co found in Fe-Co-Mo deposits reflect the competition
of alloying metal reduction from hetero-nuclear complexes and confirm mechanism
of co-deposition proposed in [32], as for Fe-Co-W alloy.
Thus ternary Fe-Co-Mo alloys were deposited by direct and pulse current from
citrate Fe(III)-based electrolyte. Variation in current density and time parameters
M. V. Ved’ et al.
Fig. 1.12 2D and 3D map and cross-sectional profile of the surface Fe-Co-Mo between markers
1 and 2 deposited in pulse mode at current density 4 A/dm 2 ; t on /t off = 10/10 ms; T = 25 ◦ C; Ó°
4.8; plated time 30 min. Scan area 5.0 × 5.0 μm
The structure of coatings Fe-Co-Mo with an iron content of 51 at.%, cobalt
36 at.%, and molybdenum 13 at.% (in terms of metal) formed on a copper
substrate with a thickness of 30 μm was examined. The results of the X-ray
diffraction analysis indicate an amorphous-crystalline structure as for Fe-Co-W
alloy. Diffraction patterns for Fe-Co-Mo alloys are characterized by the lines of
copper substrate and broad halo with a width of about 18 ◦ at angles 2θ 45–58 ◦
as can be seen in Fig. 1.13. However, the Fe-Co-Mo deposit differs from Fe-CoW films by some phases. We see lines for intermetallic phases Fe 7 ¯Ñ, Fe 7 Co, and
FeCo along with α-Fe and Fe 3 C but not any one corresponding to CoMo compounds
(Fig. 1.13). The crystallite size of the amorphous part is L = 66 Å.
Phases Fe 7 ¯Ñ and Fe 7 Co found in Fe-Co-Mo deposits reflect the competition
of alloying metal reduction from hetero-nuclear complexes and confirm mechanism
of co-deposition proposed in [32], as for Fe-Co-W alloy.
Thus ternary Fe-Co-Mo alloys were deposited by direct and pulse current from
citrate Fe(III)-based electrolyte. Variation in current density and time parameters