

266
S. G. Nedilko
40
60
80
100
120
95
96
97
98
99
100
TGA, %
C0
C1
C2
C3
a
40
60
80
100
120
-0,30
-0,25
-0,20
-0,15
-0,10
-0,05
0,00
0,05
C2
C1
DSC, (mW/mg)
T,
o
C
T,
o
C
CO
C3
b
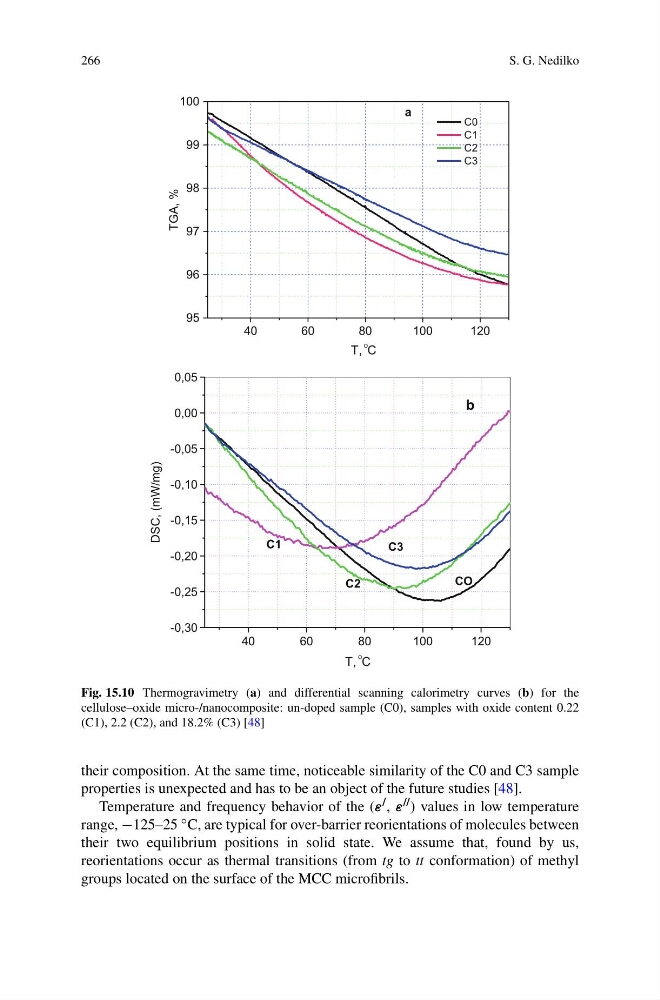
Fig. 15.10 Thermogravimetry (a) and differential scanning calorimetry curves (b) for the
cellulose–oxide micro-/nanocomposite: un-doped sample (C0), samples with oxide content 0.22
(C1), 2.2 (C2), and 18.2% (C3) [48]
their composition. At the same time, noticeable similarity of the C0 and C3 sample
properties is unexpected and has to be an object of the future studies [48].
Temperature and frequency behavior of the (ε / , ε // ) values in low temperature
range, −125–25 ◦ C, are typical for over-barrier reorientations of molecules between
their two equilibrium positions in solid state. We assume that, found by us,
reorientations occur as thermal transitions (from tg to tt conformation) of methyl
groups located on the surface of the MCC microfibrils.
S. G. Nedilko
40
60
80
100
120
95
96
97
98
99
100
TGA, %
C0
C1
C2
C3
a
40
60
80
100
120
-0,30
-0,25
-0,20
-0,15
-0,10
-0,05
0,00
0,05
C2
C1
DSC, (mW/mg)
T,
o
C
T,
o
C
CO
C3
b
Fig. 15.10 Thermogravimetry (a) and differential scanning calorimetry curves (b) for the
cellulose–oxide micro-/nanocomposite: un-doped sample (C0), samples with oxide content 0.22
(C1), 2.2 (C2), and 18.2% (C3) [48]
their composition. At the same time, noticeable similarity of the C0 and C3 sample
properties is unexpected and has to be an object of the future studies [48].
Temperature and frequency behavior of the (ε / , ε // ) values in low temperature
range, −125–25 ◦ C, are typical for over-barrier reorientations of molecules between
their two equilibrium positions in solid state. We assume that, found by us,
reorientations occur as thermal transitions (from tg to tt conformation) of methyl
groups located on the surface of the MCC microfibrils.