

254
S. G. Nedilko
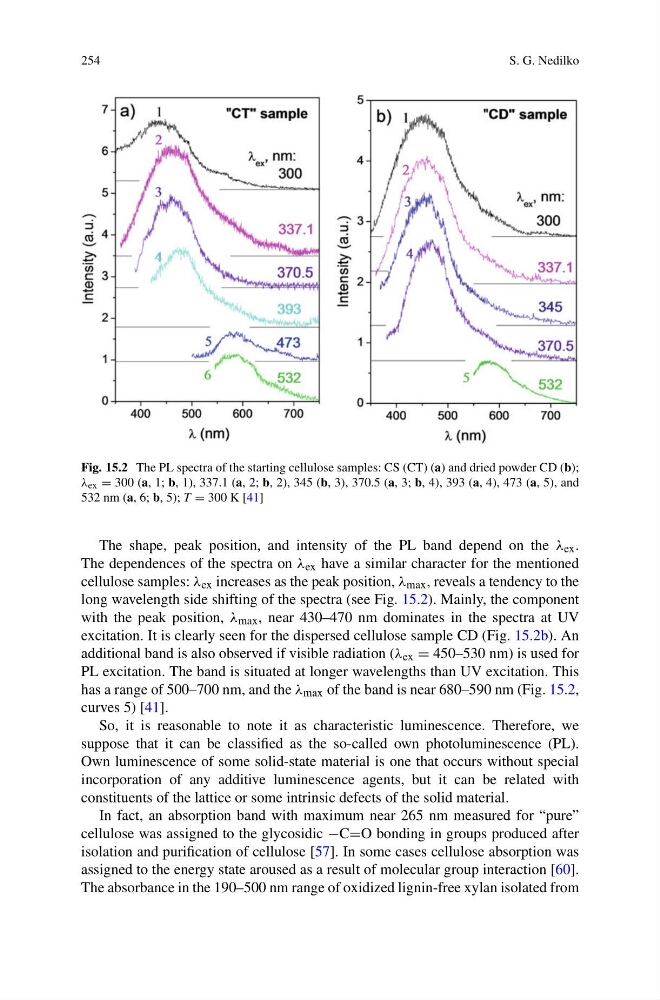
Fig. 15.2 The PL spectra of the starting cellulose samples: CS (CT) (a) and dried powder CD (b);
λ ex = 300 (a, 1; b, 1), 337.1 (a, 2; b, 2), 345 (b, 3), 370.5 (a, 3; b, 4), 393 (a, 4), 473 (a, 5), and
532 nm (a, 6; b, 5); T = 300 K [41]
The shape, peak position, and intensity of the PL band depend on the λ ex .
The dependences of the spectra on λ ex have a similar character for the mentioned
cellulose samples: λ ex increases as the peak position, λ max , reveals a tendency to the
long wavelength side shifting of the spectra (see Fig. 15.2). Mainly, the component
with the peak position, λ max , near 430–470 nm dominates in the spectra at UV
excitation. It is clearly seen for the dispersed cellulose sample CD (Fig. 15.2b). An
additional band is also observed if visible radiation (λ ex = 450–530 nm) is used for
PL excitation. The band is situated at longer wavelengths than UV excitation. This
has a range of 500–700 nm, and the λ max of the band is near 680–590 nm (Fig. 15.2,
curves 5) [41].
So, it is reasonable to note it as characteristic luminescence. Therefore, we
suppose that it can be classified as the so-called own photoluminescence (PL).
Own luminescence of some solid-state material is one that occurs without special
incorporation of any additive luminescence agents, but it can be related with
constituents of the lattice or some intrinsic defects of the solid material.
In fact, an absorption band with maximum near 265 nm measured for “pure”
cellulose was assigned to the glycosidic −C=O bonding in groups produced after
isolation and purification of cellulose [57]. In some cases cellulose absorption was
assigned to the energy state aroused as a result of molecular group interaction [60].
The absorbance in the 190–500 nm range of oxidized lignin-free xylan isolated from
S. G. Nedilko
Fig. 15.2 The PL spectra of the starting cellulose samples: CS (CT) (a) and dried powder CD (b);
λ ex = 300 (a, 1; b, 1), 337.1 (a, 2; b, 2), 345 (b, 3), 370.5 (a, 3; b, 4), 393 (a, 4), 473 (a, 5), and
532 nm (a, 6; b, 5); T = 300 K [41]
The shape, peak position, and intensity of the PL band depend on the λ ex .
The dependences of the spectra on λ ex have a similar character for the mentioned
cellulose samples: λ ex increases as the peak position, λ max , reveals a tendency to the
long wavelength side shifting of the spectra (see Fig. 15.2). Mainly, the component
with the peak position, λ max , near 430–470 nm dominates in the spectra at UV
excitation. It is clearly seen for the dispersed cellulose sample CD (Fig. 15.2b). An
additional band is also observed if visible radiation (λ ex = 450–530 nm) is used for
PL excitation. The band is situated at longer wavelengths than UV excitation. This
has a range of 500–700 nm, and the λ max of the band is near 680–590 nm (Fig. 15.2,
curves 5) [41].
So, it is reasonable to note it as characteristic luminescence. Therefore, we
suppose that it can be classified as the so-called own photoluminescence (PL).
Own luminescence of some solid-state material is one that occurs without special
incorporation of any additive luminescence agents, but it can be related with
constituents of the lattice or some intrinsic defects of the solid material.
In fact, an absorption band with maximum near 265 nm measured for “pure”
cellulose was assigned to the glycosidic −C=O bonding in groups produced after
isolation and purification of cellulose [57]. In some cases cellulose absorption was
assigned to the energy state aroused as a result of molecular group interaction [60].
The absorbance in the 190–500 nm range of oxidized lignin-free xylan isolated from