

11 Structure and Electrical/Dielectric Properties of Ion-Conductive Polymer. . .
181
Structural features of the synthesized composites have been studied using
electron microscopy (SEM) by JEOL 100CX II transmission electron microscope,
equipped with scanning system. Elemental analysis of inclusions was performed
using analytical complex consisting of the scanning electron microscope JEOL
JSM-35CF and X-ray spectrometer with dispersive in energy X-ray quanta (Model
INCA Energy-350 from “Oxford Instruments”). An important feature of such
electron microprobe analysis is its locality: maximum size of the excitation area is
2 μm. According to the morphological characteristics and the chemical composition
basing on the energy dispersive spectral analysis, the automatic separation of
inclusions on types (elemental composition) and measuring of their sizes has been
carried out. The results have been analyzed using a special program for quantitative
phase distribution and inclusions investigation. All results are presented in weight
percent. The experimental error was 0.1%.
WAXS, IR, ROM, and SEM studies and elemental analysis were carried out at
the temperature T = 20 ± 2 ◦ C.
All investigations were repeated three times for statistical data manipulation.
11.3 Results and Discussion
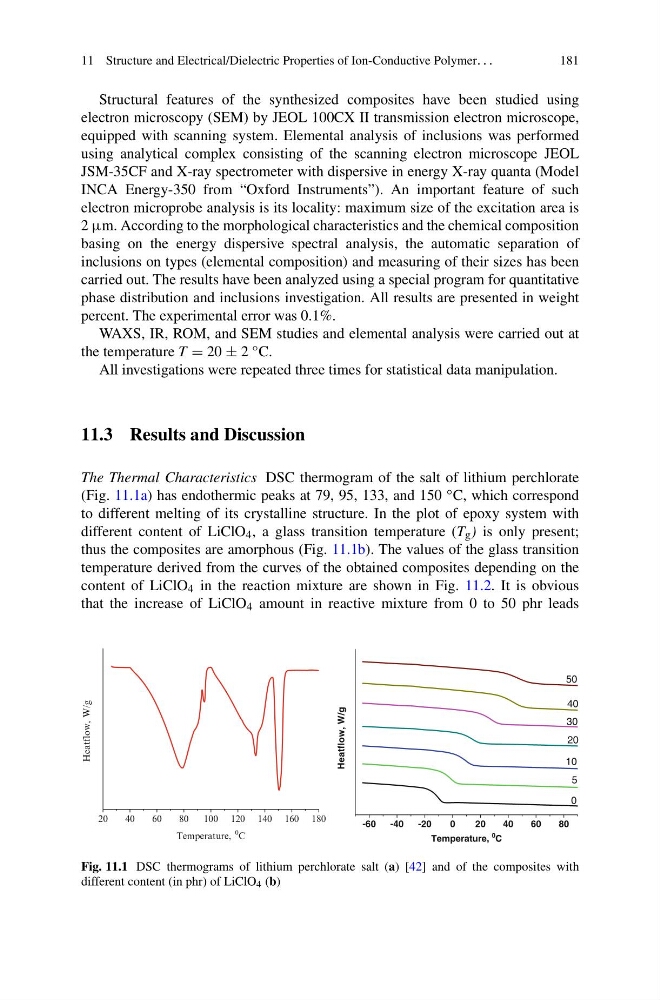
The Thermal Characteristics DSC thermogram of the salt of lithium perchlorate
(Fig. 11.1a) has endothermic peaks at 79, 95, 133, and 150 ◦ C, which correspond
to different melting of its crystalline structure. In the plot of epoxy system with
different content of LiClO 4 , a glass transition temperature (T g ) is only present;
thus the composites are amorphous (Fig. 11.1b). The values of the glass transition
temperature derived from the curves of the obtained composites depending on the
content of LiClO 4 in the reaction mixture are shown in Fig. 11.2. It is obvious
that the increase of LiClO 4 amount in reactive mixture from 0 to 50 phr leads
20
40
60
80
100 120 140 160 180
Heatflow, W/g
Temperature,
0 C
-60
-40
-20
0
20
40
60
80
5
50
40
30
20
10
Heatflow, W/g
Temperature,
0
C
0
Fig. 11.1 DSC thermograms of lithium perchlorate salt (a) [42] and of the composites with
different content (in phr) of LiClO 4 (b)
181
Structural features of the synthesized composites have been studied using
electron microscopy (SEM) by JEOL 100CX II transmission electron microscope,
equipped with scanning system. Elemental analysis of inclusions was performed
using analytical complex consisting of the scanning electron microscope JEOL
JSM-35CF and X-ray spectrometer with dispersive in energy X-ray quanta (Model
INCA Energy-350 from “Oxford Instruments”). An important feature of such
electron microprobe analysis is its locality: maximum size of the excitation area is
2 μm. According to the morphological characteristics and the chemical composition
basing on the energy dispersive spectral analysis, the automatic separation of
inclusions on types (elemental composition) and measuring of their sizes has been
carried out. The results have been analyzed using a special program for quantitative
phase distribution and inclusions investigation. All results are presented in weight
percent. The experimental error was 0.1%.
WAXS, IR, ROM, and SEM studies and elemental analysis were carried out at
the temperature T = 20 ± 2 ◦ C.
All investigations were repeated three times for statistical data manipulation.
11.3 Results and Discussion
The Thermal Characteristics DSC thermogram of the salt of lithium perchlorate
(Fig. 11.1a) has endothermic peaks at 79, 95, 133, and 150 ◦ C, which correspond
to different melting of its crystalline structure. In the plot of epoxy system with
different content of LiClO 4 , a glass transition temperature (T g ) is only present;
thus the composites are amorphous (Fig. 11.1b). The values of the glass transition
temperature derived from the curves of the obtained composites depending on the
content of LiClO 4 in the reaction mixture are shown in Fig. 11.2. It is obvious
that the increase of LiClO 4 amount in reactive mixture from 0 to 50 phr leads
20
40
60
80
100 120 140 160 180
Heatflow, W/g
Temperature,
0 C
-60
-40
-20
0
20
40
60
80
5
50
40
30
20
10
Heatflow, W/g
Temperature,
0
C
0
Fig. 11.1 DSC thermograms of lithium perchlorate salt (a) [42] and of the composites with
different content (in phr) of LiClO 4 (b)