

5 Peculiarities of the Crystal-Chemical Structure of Spinel Ferrites. . .
85
0
20
40
60
80
100
120
-1000
0
1000
2000
3000
4000
5000
6000
7000 8000
x=0,5
x=0,25
x=0,75
x=1
Н, Ое
χ, %
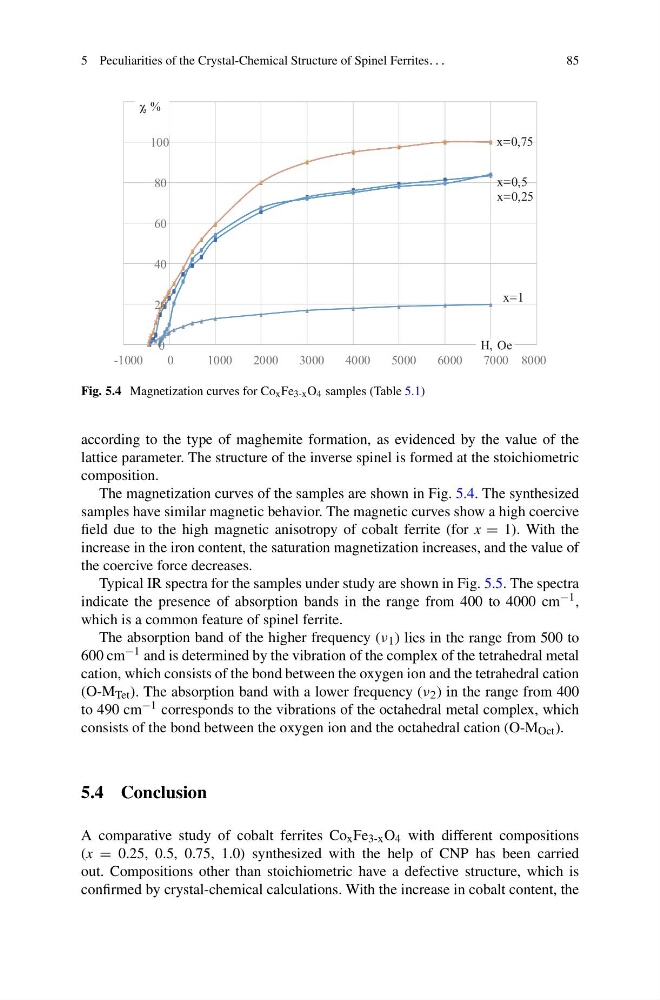
Fig. 5.4 Magnetization curves for Co x Fe 3-x O 4 samples (Table 5.1)
according to the type of maghemite formation, as evidenced by the value of the
lattice parameter. The structure of the inverse spinel is formed at the stoichiometric
composition.
The magnetization curves of the samples are shown in Fig. 5.4. The synthesized
samples have similar magnetic behavior. The magnetic curves show a high coercive
field due to the high magnetic anisotropy of cobalt ferrite (for x = 1). With the
increase in the iron content, the saturation magnetization increases, and the value of
the coercive force decreases.
Typical IR spectra for the samples under study are shown in Fig. 5.5. The spectra
indicate the presence of absorption bands in the range from 400 to 4000 cm −1 ,
which is a common feature of spinel ferrite.
The absorption band of the higher frequency (ν 1 ) lies in the range from 500 to
600 cm −1 and is determined by the vibration of the complex of the tetrahedral metal
cation, which consists of the bond between the oxygen ion and the tetrahedral cation
(O-M Tet ). The absorption band with a lower frequency (ν 2 ) in the range from 400
to 490 cm −1 corresponds to the vibrations of the octahedral metal complex, which
consists of the bond between the oxygen ion and the octahedral cation (O-M Oct ).
5.4 Conclusion
A comparative study of cobalt ferrites Co x Fe 3-x O 4 with different compositions
(x = 0.25, 0.5, 0.75, 1.0) synthesized with the help of CNP has been carried
out. Compositions other than stoichiometric have a defective structure, which is
confirmed by crystal-chemical calculations. With the increase in cobalt content, the
85
0
20
40
60
80
100
120
-1000
0
1000
2000
3000
4000
5000
6000
7000 8000
x=0,5
x=0,25
x=0,75
x=1
Н, Ое
χ, %
Fig. 5.4 Magnetization curves for Co x Fe 3-x O 4 samples (Table 5.1)
according to the type of maghemite formation, as evidenced by the value of the
lattice parameter. The structure of the inverse spinel is formed at the stoichiometric
composition.
The magnetization curves of the samples are shown in Fig. 5.4. The synthesized
samples have similar magnetic behavior. The magnetic curves show a high coercive
field due to the high magnetic anisotropy of cobalt ferrite (for x = 1). With the
increase in the iron content, the saturation magnetization increases, and the value of
the coercive force decreases.
Typical IR spectra for the samples under study are shown in Fig. 5.5. The spectra
indicate the presence of absorption bands in the range from 400 to 4000 cm −1 ,
which is a common feature of spinel ferrite.
The absorption band of the higher frequency (ν 1 ) lies in the range from 500 to
600 cm −1 and is determined by the vibration of the complex of the tetrahedral metal
cation, which consists of the bond between the oxygen ion and the tetrahedral cation
(O-M Tet ). The absorption band with a lower frequency (ν 2 ) in the range from 400
to 490 cm −1 corresponds to the vibrations of the octahedral metal complex, which
consists of the bond between the oxygen ion and the octahedral cation (O-M Oct ).
5.4 Conclusion
A comparative study of cobalt ferrites Co x Fe 3-x O 4 with different compositions
(x = 0.25, 0.5, 0.75, 1.0) synthesized with the help of CNP has been carried
out. Compositions other than stoichiometric have a defective structure, which is
confirmed by crystal-chemical calculations. With the increase in cobalt content, the