

157
Biomechanical Characterization of Human Red Blood Cells
a
b
c
d
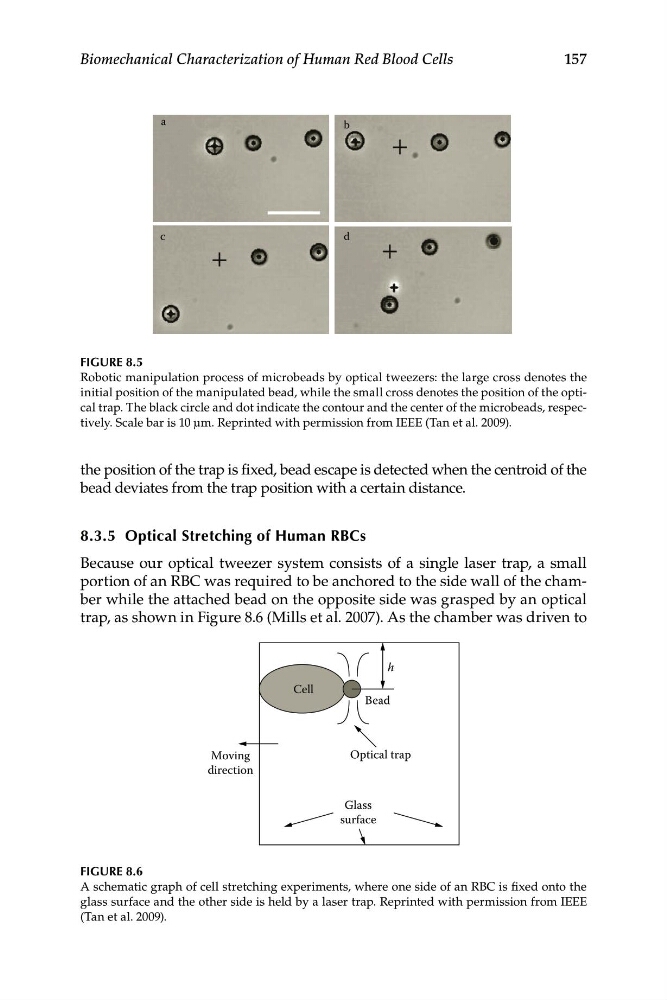
FIGURE 8.5
Robotic manipulation process of microbeads by optical tweezers: the large cross denotes the
initial position of the manipulated bead, while the small cross denotes the position of the optical trap. The black circle and dot indicate the contour and the center of the microbeads, respectively. Scale bar is 10 μm. Reprinted with permission from IEEE (Tan et al. 2009).
the position of the trap is fixed, bead escape is detected when the centroid of the
bead deviates from the trap position with a certain distance.
8.3.5 Optical Stretching of Human RBCs
Because our optical tweezer system consists of a single laser trap, a small
portion of an RBC was required to be anchored to the side wall of the chamber while the attached bead on the opposite side was grasped by an optical
trap, as shown in Figure 8.6 (Mills et al. 2007). As the chamber was driven to
Moving
direction
Cell
Bead
Optical trap
Glass
surface
h
FIGURE 8.6
A schematic graph of cell stretching experiments, where one side of an RBC is fixed onto the
glass surface and the other side is held by a laser trap. Reprinted with permission from IEEE
(Tan et al. 2009).
Biomechanical Characterization of Human Red Blood Cells
a
b
c
d
FIGURE 8.5
Robotic manipulation process of microbeads by optical tweezers: the large cross denotes the
initial position of the manipulated bead, while the small cross denotes the position of the optical trap. The black circle and dot indicate the contour and the center of the microbeads, respectively. Scale bar is 10 μm. Reprinted with permission from IEEE (Tan et al. 2009).
the position of the trap is fixed, bead escape is detected when the centroid of the
bead deviates from the trap position with a certain distance.
8.3.5 Optical Stretching of Human RBCs
Because our optical tweezer system consists of a single laser trap, a small
portion of an RBC was required to be anchored to the side wall of the chamber while the attached bead on the opposite side was grasped by an optical
trap, as shown in Figure 8.6 (Mills et al. 2007). As the chamber was driven to
Moving
direction
Cell
Bead
Optical trap
Glass
surface
h
FIGURE 8.6
A schematic graph of cell stretching experiments, where one side of an RBC is fixed onto the
glass surface and the other side is held by a laser trap. Reprinted with permission from IEEE
(Tan et al. 2009).