

142
Biologically Inspired Robotics
Oocyte
~100 μm
Lower bounds
Upper bound
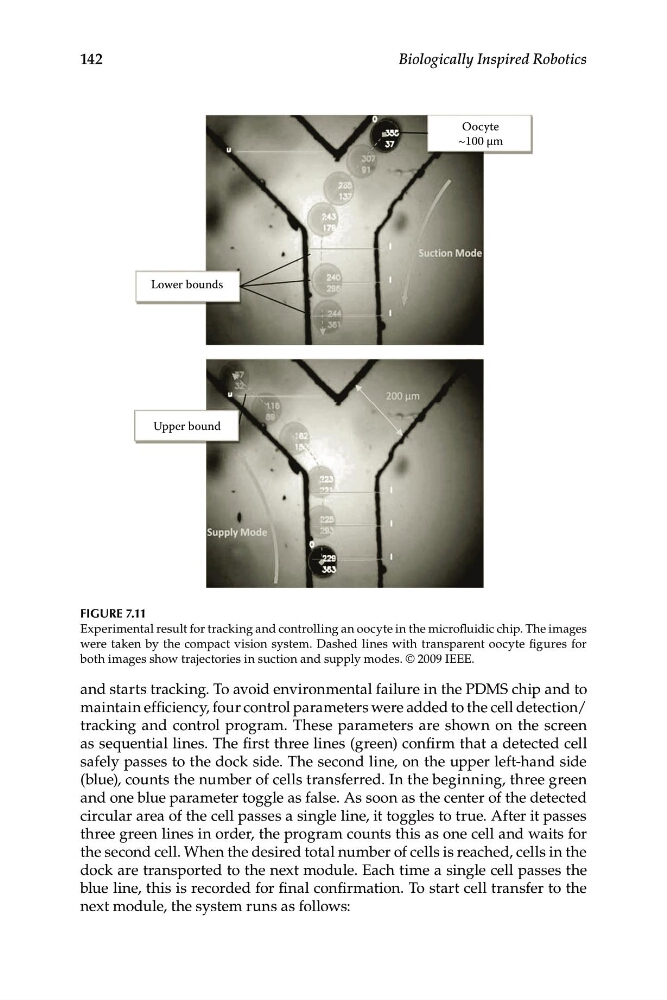
FIGURE 7.11
Experimental result for tracking and controlling an oocyte in the microfluidic chip. The images
were taken by the compact vision system. Dashed lines with transparent oocyte figures for
both images show trajectories in suction and supply modes. © 2009 IEEE.
and starts tracking. To avoid environmental failure in the PDMS chip and to
maintain efficiency, four control parameters were added to the cell detection/
tracking and control program. These parameters are shown on the screen
as sequential lines. The first three lines (green) confirm that a detected cell
safely passes to the dock side. The second line, on the upper left-hand side
(blue), counts the number of cells transferred. In the beginning, three green
and one blue parameter toggle as false. As soon as the center of the detected
circular area of the cell passes a single line, it toggles to true. After it passes
three green lines in order, the program counts this as one cell and waits for
the second cell. When the desired total number of cells is reached, cells in the
dock are transported to the next module. Each time a single cell passes the
blue line, this is recorded for final confirmation. To start cell transfer to the
next module, the system runs as follows:
Biologically Inspired Robotics
Oocyte
~100 μm
Lower bounds
Upper bound
FIGURE 7.11
Experimental result for tracking and controlling an oocyte in the microfluidic chip. The images
were taken by the compact vision system. Dashed lines with transparent oocyte figures for
both images show trajectories in suction and supply modes. © 2009 IEEE.
and starts tracking. To avoid environmental failure in the PDMS chip and to
maintain efficiency, four control parameters were added to the cell detection/
tracking and control program. These parameters are shown on the screen
as sequential lines. The first three lines (green) confirm that a detected cell
safely passes to the dock side. The second line, on the upper left-hand side
(blue), counts the number of cells transferred. In the beginning, three green
and one blue parameter toggle as false. As soon as the center of the detected
circular area of the cell passes a single line, it toggles to true. After it passes
three green lines in order, the program counts this as one cell and waits for
the second cell. When the desired total number of cells is reached, cells in the
dock are transported to the next module. Each time a single cell passes the
blue line, this is recorded for final confirmation. To start cell transfer to the
next module, the system runs as follows: