

Hydrochemical Analysis of Six Sacred Lakes …
55
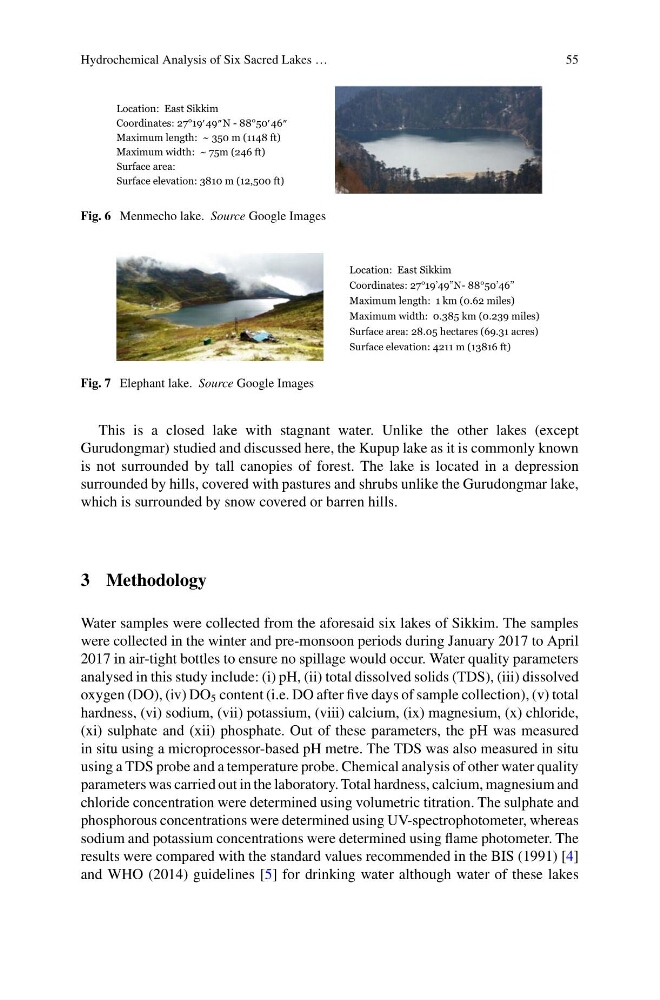
Location: East Sikkim
Coordinates: 27°19 49 N - 88°50 46
Maximum length: ~ 350 m (1148 ft)
Maximum width: ~ 75m (246 ft)
Surface area:
Surface elevation: 3810 m (12,500 ft)
Fig. 6 Menmecho lake. Source Google Images
Location: East Sikkim
Coordinates: 27°19’49”N- 88°50’46”
Maximum length: 1 km (0.62 miles)
Maximum width: 0.385 km (0.239 miles)
Surface area: 28.05 hectares (69.31 acres)
Surface elevation: 4211 m (13816 ft)
Fig. 7 Elephant lake. Source Google Images
This is a closed lake with stagnant water. Unlike the other lakes (except
Gurudongmar) studied and discussed here, the Kupup lake as it is commonly known
is not surrounded by tall canopies of forest. The lake is located in a depression
surrounded by hills, covered with pastures and shrubs unlike the Gurudongmar lake,
which is surrounded by snow covered or barren hills.
3 Methodology
Water samples were collected from the aforesaid six lakes of Sikkim. The samples
were collected in the winter and pre-monsoon periods during January 2017 to April
2017 in air-tight bottles to ensure no spillage would occur. Water quality parameters
analysed in this study include: (i) pH, (ii) total dissolved solids (TDS), (iii) dissolved
oxygen (DO), (iv) DO 5 content (i.e. DO after five days of sample collection), (v) total
hardness, (vi) sodium, (vii) potassium, (viii) calcium, (ix) magnesium, (x) chloride,
(xi) sulphate and (xii) phosphate. Out of these parameters, the pH was measured
in situ using a microprocessor-based pH metre. The TDS was also measured in situ
using a TDS probe and a temperature probe. Chemical analysis of other water quality
parameters was carried out in the laboratory. Total hardness, calcium, magnesium and
chloride concentration were determined using volumetric titration. The sulphate and
phosphorous concentrations were determined using UV-spectrophotometer, whereas
sodium and potassium concentrations were determined using flame photometer. The
results were compared with the standard values recommended in the BIS (1991) [4]
and WHO (2014) guidelines [5] for drinking water although water of these lakes
55
Location: East Sikkim
Coordinates: 27°19 49 N - 88°50 46
Maximum length: ~ 350 m (1148 ft)
Maximum width: ~ 75m (246 ft)
Surface area:
Surface elevation: 3810 m (12,500 ft)
Fig. 6 Menmecho lake. Source Google Images
Location: East Sikkim
Coordinates: 27°19’49”N- 88°50’46”
Maximum length: 1 km (0.62 miles)
Maximum width: 0.385 km (0.239 miles)
Surface area: 28.05 hectares (69.31 acres)
Surface elevation: 4211 m (13816 ft)
Fig. 7 Elephant lake. Source Google Images
This is a closed lake with stagnant water. Unlike the other lakes (except
Gurudongmar) studied and discussed here, the Kupup lake as it is commonly known
is not surrounded by tall canopies of forest. The lake is located in a depression
surrounded by hills, covered with pastures and shrubs unlike the Gurudongmar lake,
which is surrounded by snow covered or barren hills.
3 Methodology
Water samples were collected from the aforesaid six lakes of Sikkim. The samples
were collected in the winter and pre-monsoon periods during January 2017 to April
2017 in air-tight bottles to ensure no spillage would occur. Water quality parameters
analysed in this study include: (i) pH, (ii) total dissolved solids (TDS), (iii) dissolved
oxygen (DO), (iv) DO 5 content (i.e. DO after five days of sample collection), (v) total
hardness, (vi) sodium, (vii) potassium, (viii) calcium, (ix) magnesium, (x) chloride,
(xi) sulphate and (xii) phosphate. Out of these parameters, the pH was measured
in situ using a microprocessor-based pH metre. The TDS was also measured in situ
using a TDS probe and a temperature probe. Chemical analysis of other water quality
parameters was carried out in the laboratory. Total hardness, calcium, magnesium and
chloride concentration were determined using volumetric titration. The sulphate and
phosphorous concentrations were determined using UV-spectrophotometer, whereas
sodium and potassium concentrations were determined using flame photometer. The
results were compared with the standard values recommended in the BIS (1991) [4]
and WHO (2014) guidelines [5] for drinking water although water of these lakes