

Error Estimation for Forecasting of Orographic …
303
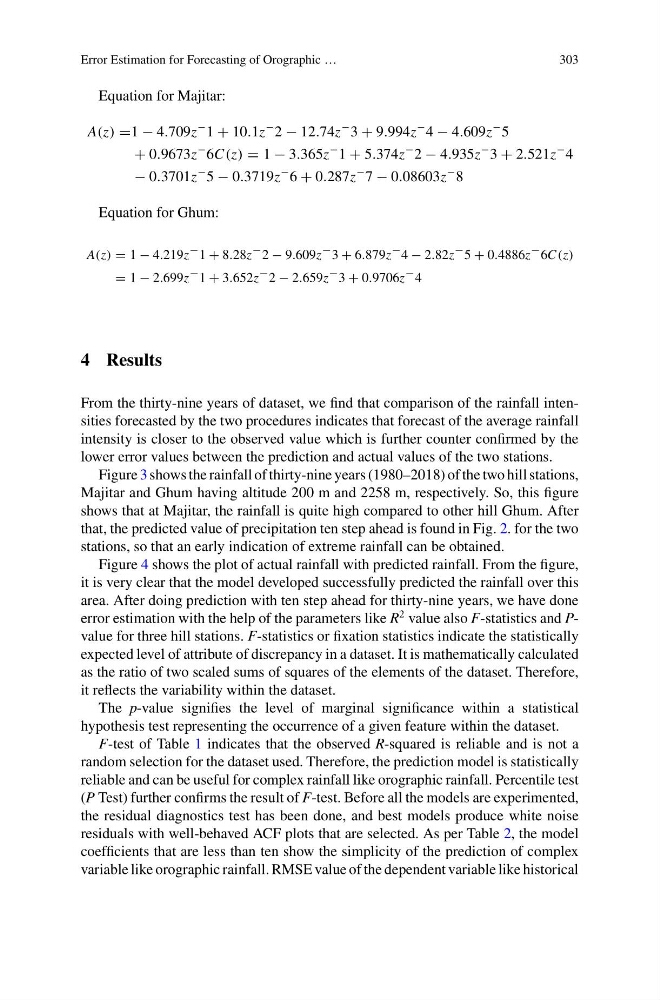
Equation for Majitar:
A(z) =1 − 4.709z
− 1 + 10.1z
− 2 − 12.74z
− 3 + 9.994z
− 4 − 4.609z
− 5
+ 0.9673z
− 6C(z) = 1 − 3.365z
− 1 + 5.374z
− 2 − 4.935z
− 3 + 2.521z
− 4
− 0.3701z
− 5 − 0.3719z
− 6 + 0.287z
− 7 − 0.08603z
− 8
Equation for Ghum:
A(z) = 1 − 4.219z − 1 + 8.28z − 2 − 9.609z − 3 + 6.879z − 4 − 2.82z − 5 + 0.4886z − 6C(z)
= 1 − 2.699z − 1 + 3.652z − 2 − 2.659z − 3 + 0.9706z − 4
4 Results
From the thirty-nine years of dataset, we find that comparison of the rainfall intensities forecasted by the two procedures indicates that forecast of the average rainfall
intensity is closer to the observed value which is further counter confirmed by the
lower error values between the prediction and actual values of the two stations.
Figure 3 shows the rainfall of thirty-nine years (1980–2018) of the two hill stations,
Majitar and Ghum having altitude 200 m and 2258 m, respectively. So, this figure
shows that at Majitar, the rainfall is quite high compared to other hill Ghum. After
that, the predicted value of precipitation ten step ahead is found in Fig. 2. for the two
stations, so that an early indication of extreme rainfall can be obtained.
Figure 4 shows the plot of actual rainfall with predicted rainfall. From the figure,
it is very clear that the model developed successfully predicted the rainfall over this
area. After doing prediction with ten step ahead for thirty-nine years, we have done
error estimation with the help of the parameters like R
2 value also F-statistics and Pvalue for three hill stations. F-statistics or fixation statistics indicate the statistically
expected level of attribute of discrepancy in a dataset. It is mathematically calculated
as the ratio of two scaled sums of squares of the elements of the dataset. Therefore,
it reflects the variability within the dataset.
The p-value signifies the level of marginal significance within a statistical
hypothesis test representing the occurrence of a given feature within the dataset.
F-test of Table 1 indicates that the observed R-squared is reliable and is not a
random selection for the dataset used. Therefore, the prediction model is statistically
reliable and can be useful for complex rainfall like orographic rainfall. Percentile test
(P Test) further confirms the result of F-test. Before all the models are experimented,
the residual diagnostics test has been done, and best models produce white noise
residuals with well-behaved ACF plots that are selected. As per Table 2, the model
coefficients that are less than ten show the simplicity of the prediction of complex
variable like orographic rainfall. RMSE value of the dependent variable like historical
303
Equation for Majitar:
A(z) =1 − 4.709z
− 1 + 10.1z
− 2 − 12.74z
− 3 + 9.994z
− 4 − 4.609z
− 5
+ 0.9673z
− 6C(z) = 1 − 3.365z
− 1 + 5.374z
− 2 − 4.935z
− 3 + 2.521z
− 4
− 0.3701z
− 5 − 0.3719z
− 6 + 0.287z
− 7 − 0.08603z
− 8
Equation for Ghum:
A(z) = 1 − 4.219z − 1 + 8.28z − 2 − 9.609z − 3 + 6.879z − 4 − 2.82z − 5 + 0.4886z − 6C(z)
= 1 − 2.699z − 1 + 3.652z − 2 − 2.659z − 3 + 0.9706z − 4
4 Results
From the thirty-nine years of dataset, we find that comparison of the rainfall intensities forecasted by the two procedures indicates that forecast of the average rainfall
intensity is closer to the observed value which is further counter confirmed by the
lower error values between the prediction and actual values of the two stations.
Figure 3 shows the rainfall of thirty-nine years (1980–2018) of the two hill stations,
Majitar and Ghum having altitude 200 m and 2258 m, respectively. So, this figure
shows that at Majitar, the rainfall is quite high compared to other hill Ghum. After
that, the predicted value of precipitation ten step ahead is found in Fig. 2. for the two
stations, so that an early indication of extreme rainfall can be obtained.
Figure 4 shows the plot of actual rainfall with predicted rainfall. From the figure,
it is very clear that the model developed successfully predicted the rainfall over this
area. After doing prediction with ten step ahead for thirty-nine years, we have done
error estimation with the help of the parameters like R
2 value also F-statistics and Pvalue for three hill stations. F-statistics or fixation statistics indicate the statistically
expected level of attribute of discrepancy in a dataset. It is mathematically calculated
as the ratio of two scaled sums of squares of the elements of the dataset. Therefore,
it reflects the variability within the dataset.
The p-value signifies the level of marginal significance within a statistical
hypothesis test representing the occurrence of a given feature within the dataset.
F-test of Table 1 indicates that the observed R-squared is reliable and is not a
random selection for the dataset used. Therefore, the prediction model is statistically
reliable and can be useful for complex rainfall like orographic rainfall. Percentile test
(P Test) further confirms the result of F-test. Before all the models are experimented,
the residual diagnostics test has been done, and best models produce white noise
residuals with well-behaved ACF plots that are selected. As per Table 2, the model
coefficients that are less than ten show the simplicity of the prediction of complex
variable like orographic rainfall. RMSE value of the dependent variable like historical