

198
S. K. Lahiri et al.
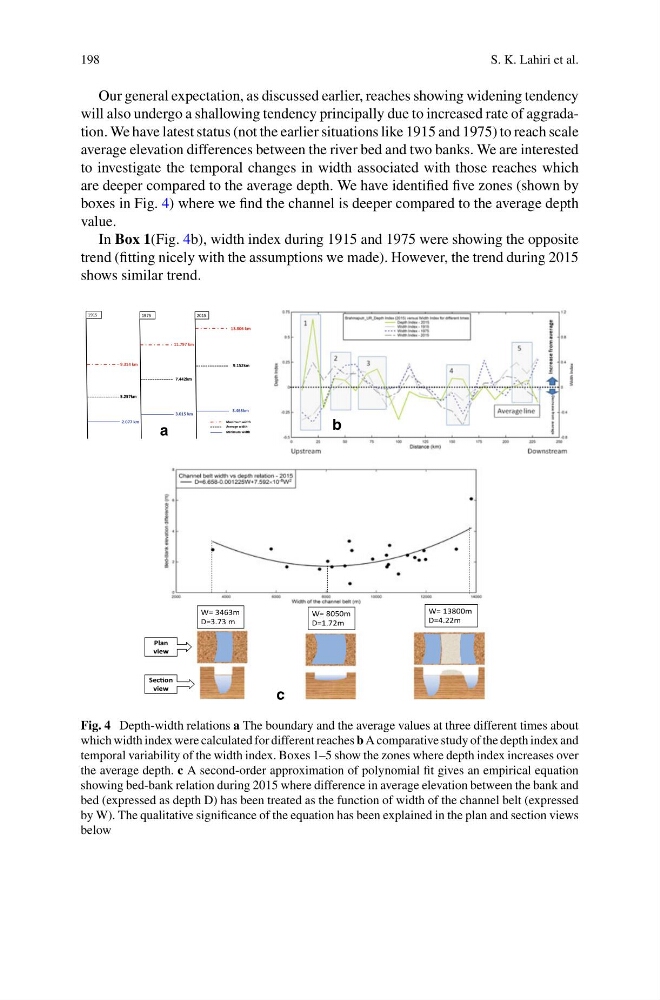
Our general expectation, as discussed earlier, reaches showing widening tendency
will also undergo a shallowing tendency principally due to increased rate of aggradation. We have latest status (not the earlier situations like 1915 and 1975) to reach scale
average elevation differences between the river bed and two banks. We are interested
to investigate the temporal changes in width associated with those reaches which
are deeper compared to the average depth. We have identified five zones (shown by
boxes in Fig. 4) where we find the channel is deeper compared to the average depth
value.
In Box 1(Fig. 4b), width index during 1915 and 1975 were showing the opposite
trend (fitting nicely with the assumptions we made). However, the trend during 2015
shows similar trend.
1915
1975
2015
13.806 km
11.797 km
9.314 km
2.077 km
3.015 km
3.463km
5.257km
7.442km
9.152km
Maximum width
Average width
Minimum width
a
b
W= 8050m
D=1.72m
W= 3463m
D=3.73 m
W= 13800m
D=4.22m
Plan
view
SecƟon
view
c
Fig. 4 Depth-width relations a The boundary and the average values at three different times about
which width index were calculated for different reaches b A comparative study of the depth index and
temporal variability of the width index. Boxes 1–5 show the zones where depth index increases over
the average depth. c A second-order approximation of polynomial fit gives an empirical equation
showing bed-bank relation during 2015 where difference in average elevation between the bank and
bed (expressed as depth D) has been treated as the function of width of the channel belt (expressed
by W). The qualitative significance of the equation has been explained in the plan and section views
below
S. K. Lahiri et al.
Our general expectation, as discussed earlier, reaches showing widening tendency
will also undergo a shallowing tendency principally due to increased rate of aggradation. We have latest status (not the earlier situations like 1915 and 1975) to reach scale
average elevation differences between the river bed and two banks. We are interested
to investigate the temporal changes in width associated with those reaches which
are deeper compared to the average depth. We have identified five zones (shown by
boxes in Fig. 4) where we find the channel is deeper compared to the average depth
value.
In Box 1(Fig. 4b), width index during 1915 and 1975 were showing the opposite
trend (fitting nicely with the assumptions we made). However, the trend during 2015
shows similar trend.
1915
1975
2015
13.806 km
11.797 km
9.314 km
2.077 km
3.015 km
3.463km
5.257km
7.442km
9.152km
Maximum width
Average width
Minimum width
a
b
W= 8050m
D=1.72m
W= 3463m
D=3.73 m
W= 13800m
D=4.22m
Plan
view
SecƟon
view
c
Fig. 4 Depth-width relations a The boundary and the average values at three different times about
which width index were calculated for different reaches b A comparative study of the depth index and
temporal variability of the width index. Boxes 1–5 show the zones where depth index increases over
the average depth. c A second-order approximation of polynomial fit gives an empirical equation
showing bed-bank relation during 2015 where difference in average elevation between the bank and
bed (expressed as depth D) has been treated as the function of width of the channel belt (expressed
by W). The qualitative significance of the equation has been explained in the plan and section views
below