

Flood Hazard Mapping and Vulnerability Analysis …
189
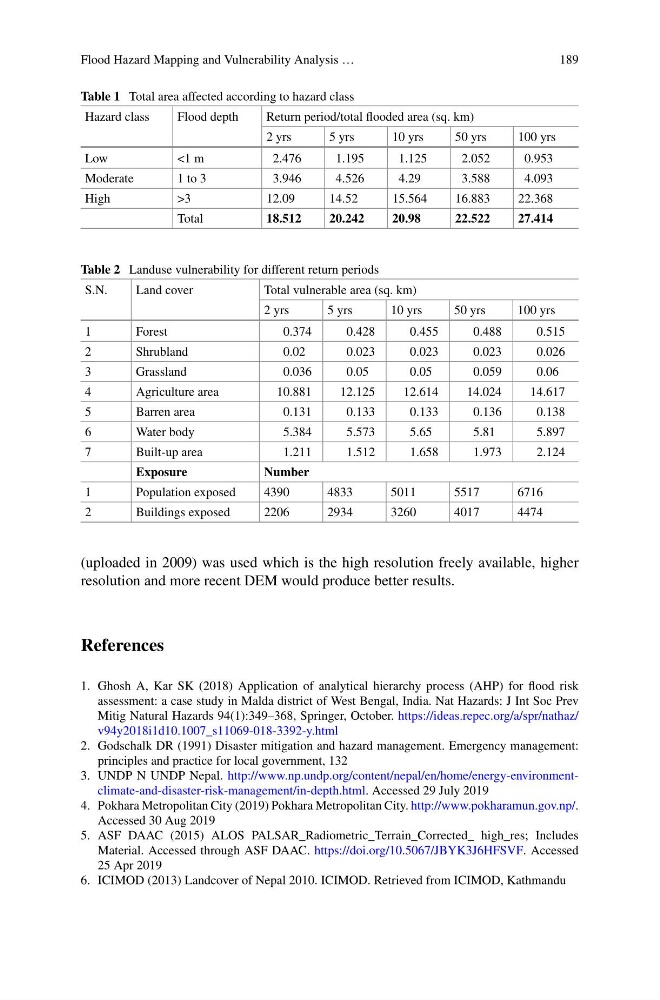
Table 1 Total area affected according to hazard class
Hazard class
Flood depth
Return period/total flooded area (sq. km)
2 yrs
5 yrs
10 yrs
50 yrs
100 yrs
Low
<1 m
2.476
1.195
1.125
2.052
0.953
Moderate
1 to 3
3.946
4.526
4.29
3.588
4.093
High
>3
12.09
14.52
15.564
16.883
22.368
Total
18.512
20.242
20.98
22.522
27.414
Table 2 Landuse vulnerability for different return periods
S.N.
Land cover
Total vulnerable area (sq. km)
2 yrs
5 yrs
10 yrs
50 yrs
100 yrs
1
Forest
0.374
0.428
0.455
0.488
0.515
2
Shrubland
0.02
0.023
0.023
0.023
0.026
3
Grassland
0.036
0.05
0.05
0.059
0.06
4
Agriculture area
10.881
12.125
12.614
14.024
14.617
5
Barren area
0.131
0.133
0.133
0.136
0.138
6
Water body
5.384
5.573
5.65
5.81
5.897
7
Built-up area
1.211
1.512
1.658
1.973
2.124
Exposure
Number
1
Population exposed
4390
4833
5011
5517
6716
2
Buildings exposed
2206
2934
3260
4017
4474
(uploaded in 2009) was used which is the high resolution freely available, higher
resolution and more recent DEM would produce better results.
References
1. Ghosh A, Kar SK (2018) Application of analytical hierarchy process (AHP) for flood risk
assessment: a case study in Malda district of West Bengal, India. Nat Hazards: J Int Soc Prev
Mitig Natural Hazards 94(1):349–368, Springer, October. https://ideas.repec.org/a/spr/nathaz/
v94y2018i1d10.1007_s11069-018-3392-y.html
2. Godschalk DR (1991) Disaster mitigation and hazard management. Emergency management:
principles and practice for local government, 132
3. UNDP N UNDP Nepal. http://www.np.undp.org/content/nepal/en/home/energy-environmentclimate-and-disaster-risk-management/in-depth.html. Accessed 29 July 2019
4. Pokhara Metropolitan City (2019) Pokhara Metropolitan City. http://www.pokharamun.gov.np/.
Accessed 30 Aug 2019
5. ASF DAAC (2015) ALOS PALSAR_Radiometric_Terrain_Corrected_ high_res; Includes
Material. Accessed through ASF DAAC. https://doi.org/10.5067/JBYK3J6HFSVF. Accessed
25 Apr 2019
6. ICIMOD (2013) Landcover of Nepal 2010. ICIMOD. Retrieved from ICIMOD, Kathmandu
189
Table 1 Total area affected according to hazard class
Hazard class
Flood depth
Return period/total flooded area (sq. km)
2 yrs
5 yrs
10 yrs
50 yrs
100 yrs
Low
<1 m
2.476
1.195
1.125
2.052
0.953
Moderate
1 to 3
3.946
4.526
4.29
3.588
4.093
High
>3
12.09
14.52
15.564
16.883
22.368
Total
18.512
20.242
20.98
22.522
27.414
Table 2 Landuse vulnerability for different return periods
S.N.
Land cover
Total vulnerable area (sq. km)
2 yrs
5 yrs
10 yrs
50 yrs
100 yrs
1
Forest
0.374
0.428
0.455
0.488
0.515
2
Shrubland
0.02
0.023
0.023
0.023
0.026
3
Grassland
0.036
0.05
0.05
0.059
0.06
4
Agriculture area
10.881
12.125
12.614
14.024
14.617
5
Barren area
0.131
0.133
0.133
0.136
0.138
6
Water body
5.384
5.573
5.65
5.81
5.897
7
Built-up area
1.211
1.512
1.658
1.973
2.124
Exposure
Number
1
Population exposed
4390
4833
5011
5517
6716
2
Buildings exposed
2206
2934
3260
4017
4474
(uploaded in 2009) was used which is the high resolution freely available, higher
resolution and more recent DEM would produce better results.
References
1. Ghosh A, Kar SK (2018) Application of analytical hierarchy process (AHP) for flood risk
assessment: a case study in Malda district of West Bengal, India. Nat Hazards: J Int Soc Prev
Mitig Natural Hazards 94(1):349–368, Springer, October. https://ideas.repec.org/a/spr/nathaz/
v94y2018i1d10.1007_s11069-018-3392-y.html
2. Godschalk DR (1991) Disaster mitigation and hazard management. Emergency management:
principles and practice for local government, 132
3. UNDP N UNDP Nepal. http://www.np.undp.org/content/nepal/en/home/energy-environmentclimate-and-disaster-risk-management/in-depth.html. Accessed 29 July 2019
4. Pokhara Metropolitan City (2019) Pokhara Metropolitan City. http://www.pokharamun.gov.np/.
Accessed 30 Aug 2019
5. ASF DAAC (2015) ALOS PALSAR_Radiometric_Terrain_Corrected_ high_res; Includes
Material. Accessed through ASF DAAC. https://doi.org/10.5067/JBYK3J6HFSVF. Accessed
25 Apr 2019
6. ICIMOD (2013) Landcover of Nepal 2010. ICIMOD. Retrieved from ICIMOD, Kathmandu