

166
R. Murmu and S. Murmu
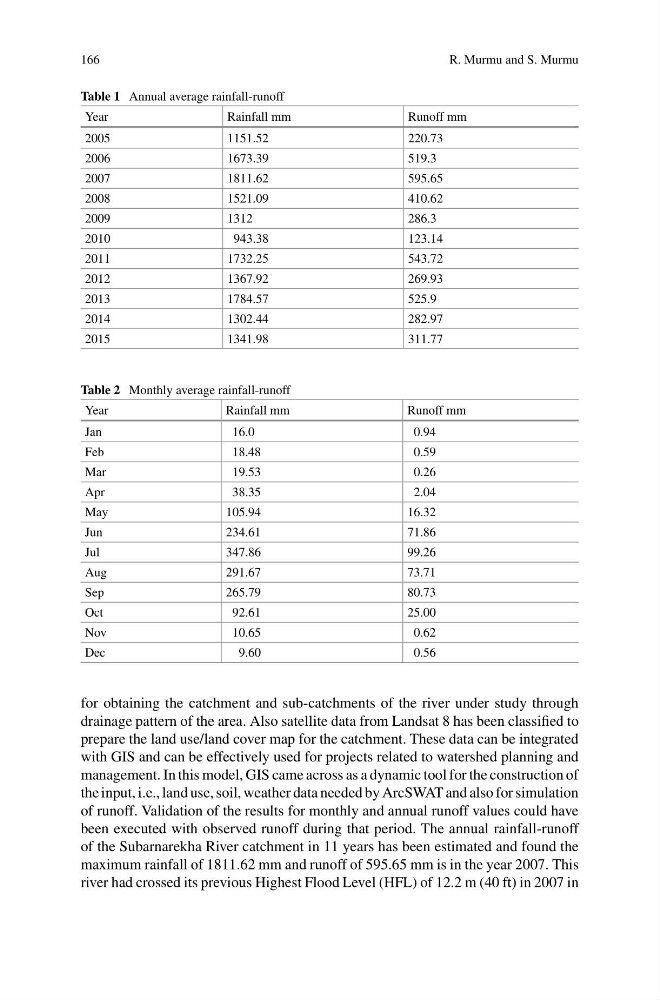
Table 1 Annual average rainfall-runoff
Year
Rainfall mm
Runoff mm
2005
1151.52
220.73
2006
1673.39
519.3
2007
1811.62
595.65
2008
1521.09
410.62
2009
1312
286.3
2010
943.38
123.14
2011
1732.25
543.72
2012
1367.92
269.93
2013
1784.57
525.9
2014
1302.44
282.97
2015
1341.98
311.77
Table 2 Monthly average rainfall-runoff
Year
Rainfall mm
Runoff mm
Jan
16.0
0.94
Feb
18.48
0.59
Mar
19.53
0.26
Apr
38.35
2.04
May
105.94
16.32
Jun
234.61
71.86
Jul
347.86
99.26
Aug
291.67
73.71
Sep
265.79
80.73
Oct
92.61
25.00
Nov
10.65
0.62
Dec
9.60
0.56
for obtaining the catchment and sub-catchments of the river under study through
drainage pattern of the area. Also satellite data from Landsat 8 has been classified to
prepare the land use/land cover map for the catchment. These data can be integrated
with GIS and can be effectively used for projects related to watershed planning and
management. In this model, GIS came across as a dynamic tool for the construction of
the input, i.e., land use, soil, weather data needed by ArcSWAT and also for simulation
of runoff. Validation of the results for monthly and annual runoff values could have
been executed with observed runoff during that period. The annual rainfall-runoff
of the Subarnarekha River catchment in 11 years has been estimated and found the
maximum rainfall of 1811.62 mm and runoff of 595.65 mm is in the year 2007. This
river had crossed its previous Highest Flood Level (HFL) of 12.2 m (40 ft) in 2007 in
R. Murmu and S. Murmu
Table 1 Annual average rainfall-runoff
Year
Rainfall mm
Runoff mm
2005
1151.52
220.73
2006
1673.39
519.3
2007
1811.62
595.65
2008
1521.09
410.62
2009
1312
286.3
2010
943.38
123.14
2011
1732.25
543.72
2012
1367.92
269.93
2013
1784.57
525.9
2014
1302.44
282.97
2015
1341.98
311.77
Table 2 Monthly average rainfall-runoff
Year
Rainfall mm
Runoff mm
Jan
16.0
0.94
Feb
18.48
0.59
Mar
19.53
0.26
Apr
38.35
2.04
May
105.94
16.32
Jun
234.61
71.86
Jul
347.86
99.26
Aug
291.67
73.71
Sep
265.79
80.73
Oct
92.61
25.00
Nov
10.65
0.62
Dec
9.60
0.56
for obtaining the catchment and sub-catchments of the river under study through
drainage pattern of the area. Also satellite data from Landsat 8 has been classified to
prepare the land use/land cover map for the catchment. These data can be integrated
with GIS and can be effectively used for projects related to watershed planning and
management. In this model, GIS came across as a dynamic tool for the construction of
the input, i.e., land use, soil, weather data needed by ArcSWAT and also for simulation
of runoff. Validation of the results for monthly and annual runoff values could have
been executed with observed runoff during that period. The annual rainfall-runoff
of the Subarnarekha River catchment in 11 years has been estimated and found the
maximum rainfall of 1811.62 mm and runoff of 595.65 mm is in the year 2007. This
river had crossed its previous Highest Flood Level (HFL) of 12.2 m (40 ft) in 2007 in