

146
S. Santra and S. Biswas
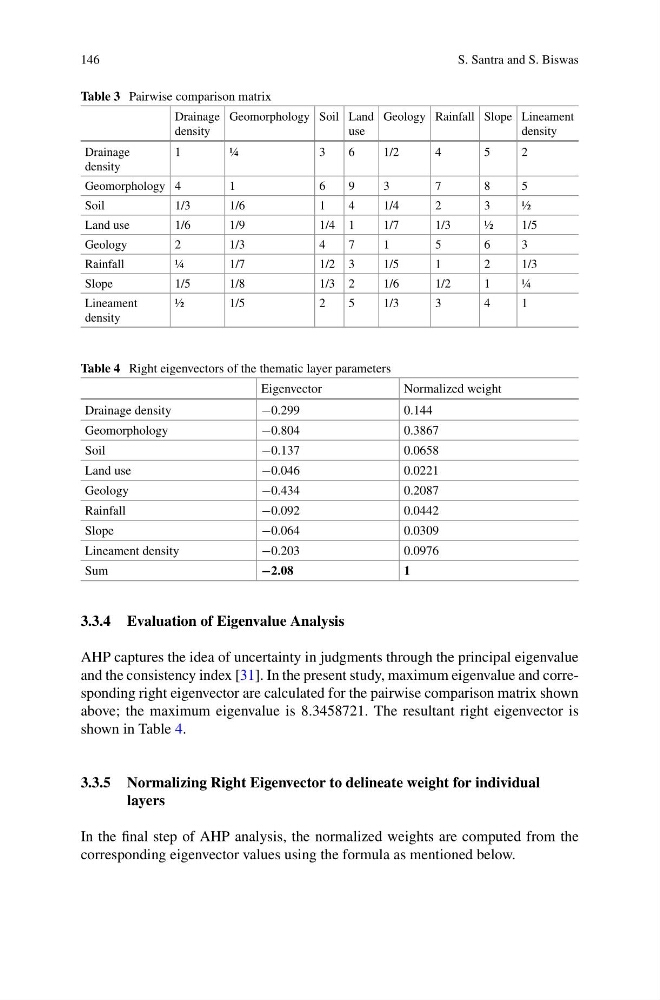
Table 3 Pairwise comparison matrix
Drainage
density
Geomorphology Soil Land
use
Geology Rainfall Slope Lineament
density
Drainage
density
1
¼
3
6
1/2
4
5
2
Geomorphology 4
1
6
9
3
7
8
5
Soil
1/3
1/6
1
4
1/4
2
3
½
Land use
1/6
1/9
1/4 1
1/7
1/3
½
1/5
Geology
2
1/3
4
7
1
5
6
3
Rainfall
¼
1/7
1/2 3
1/5
1
2
1/3
Slope
1/5
1/8
1/3 2
1/6
1/2
1
¼
Lineament
density
½
1/5
2
5
1/3
3
4
1
Table 4 Right eigenvectors of the thematic layer parameters
Eigenvector
Normalized weight
Drainage density
−0.299
0.144
Geomorphology
−0.804
0.3867
Soil
−0.137
0.0658
Land use
−0.046
0.0221
Geology
−0.434
0.2087
Rainfall
−0.092
0.0442
Slope
−0.064
0.0309
Lineament density
−0.203
0.0976
Sum
−2.08
1
3.3.4 Evaluation of Eigenvalue Analysis
AHP captures the idea of uncertainty in judgments through the principal eigenvalue
and the consistency index [31]. In the present study, maximum eigenvalue and corresponding right eigenvector are calculated for the pairwise comparison matrix shown
above; the maximum eigenvalue is 8.3458721. The resultant right eigenvector is
shown in Table 4.
3.3.5 Normalizing Right Eigenvector to delineate weight for individual
layers
In the final step of AHP analysis, the normalized weights are computed from the
corresponding eigenvector values using the formula as mentioned below.
S. Santra and S. Biswas
Table 3 Pairwise comparison matrix
Drainage
density
Geomorphology Soil Land
use
Geology Rainfall Slope Lineament
density
Drainage
density
1
¼
3
6
1/2
4
5
2
Geomorphology 4
1
6
9
3
7
8
5
Soil
1/3
1/6
1
4
1/4
2
3
½
Land use
1/6
1/9
1/4 1
1/7
1/3
½
1/5
Geology
2
1/3
4
7
1
5
6
3
Rainfall
¼
1/7
1/2 3
1/5
1
2
1/3
Slope
1/5
1/8
1/3 2
1/6
1/2
1
¼
Lineament
density
½
1/5
2
5
1/3
3
4
1
Table 4 Right eigenvectors of the thematic layer parameters
Eigenvector
Normalized weight
Drainage density
−0.299
0.144
Geomorphology
−0.804
0.3867
Soil
−0.137
0.0658
Land use
−0.046
0.0221
Geology
−0.434
0.2087
Rainfall
−0.092
0.0442
Slope
−0.064
0.0309
Lineament density
−0.203
0.0976
Sum
−2.08
1
3.3.4 Evaluation of Eigenvalue Analysis
AHP captures the idea of uncertainty in judgments through the principal eigenvalue
and the consistency index [31]. In the present study, maximum eigenvalue and corresponding right eigenvector are calculated for the pairwise comparison matrix shown
above; the maximum eigenvalue is 8.3458721. The resultant right eigenvector is
shown in Table 4.
3.3.5 Normalizing Right Eigenvector to delineate weight for individual
layers
In the final step of AHP analysis, the normalized weights are computed from the
corresponding eigenvector values using the formula as mentioned below.