

142
S. Santra and S. Biswas
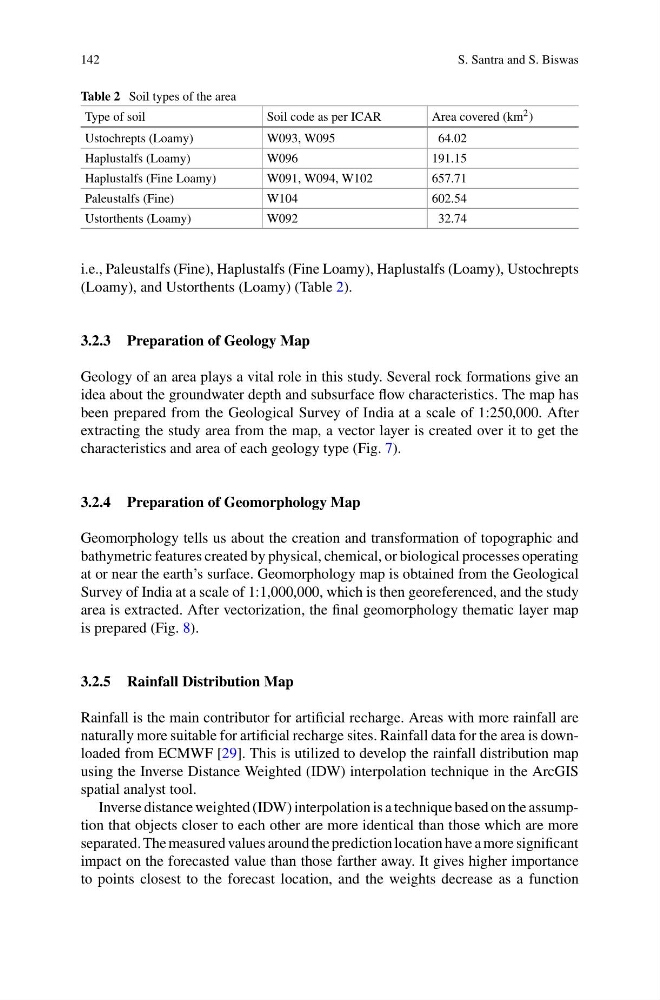
Table 2 Soil types of the area
Type of soil
Soil code as per ICAR
Area covered (km 2 )
Ustochrepts (Loamy)
W093, W095
64.02
Haplustalfs (Loamy)
W096
191.15
Haplustalfs (Fine Loamy)
W091, W094, W102
657.71
Paleustalfs (Fine)
W104
602.54
Ustorthents (Loamy)
W092
32.74
i.e., Paleustalfs (Fine), Haplustalfs (Fine Loamy), Haplustalfs (Loamy), Ustochrepts
(Loamy), and Ustorthents (Loamy) (Table 2).
3.2.3 Preparation of Geology Map
Geology of an area plays a vital role in this study. Several rock formations give an
idea about the groundwater depth and subsurface flow characteristics. The map has
been prepared from the Geological Survey of India at a scale of 1:250,000. After
extracting the study area from the map, a vector layer is created over it to get the
characteristics and area of each geology type (Fig. 7).
3.2.4 Preparation of Geomorphology Map
Geomorphology tells us about the creation and transformation of topographic and
bathymetric features created by physical, chemical, or biological processes operating
at or near the earth’s surface. Geomorphology map is obtained from the Geological
Survey of India at a scale of 1:1,000,000, which is then georeferenced, and the study
area is extracted. After vectorization, the final geomorphology thematic layer map
is prepared (Fig. 8).
3.2.5 Rainfall Distribution Map
Rainfall is the main contributor for artificial recharge. Areas with more rainfall are
naturally more suitable for artificial recharge sites. Rainfall data for the area is downloaded from ECMWF [29]. This is utilized to develop the rainfall distribution map
using the Inverse Distance Weighted (IDW) interpolation technique in the ArcGIS
spatial analyst tool.
Inverse distance weighted (IDW) interpolation is a technique based on the assumption that objects closer to each other are more identical than those which are more
separated. The measured values around the prediction location have a more significant
impact on the forecasted value than those farther away. It gives higher importance
to points closest to the forecast location, and the weights decrease as a function
S. Santra and S. Biswas
Table 2 Soil types of the area
Type of soil
Soil code as per ICAR
Area covered (km 2 )
Ustochrepts (Loamy)
W093, W095
64.02
Haplustalfs (Loamy)
W096
191.15
Haplustalfs (Fine Loamy)
W091, W094, W102
657.71
Paleustalfs (Fine)
W104
602.54
Ustorthents (Loamy)
W092
32.74
i.e., Paleustalfs (Fine), Haplustalfs (Fine Loamy), Haplustalfs (Loamy), Ustochrepts
(Loamy), and Ustorthents (Loamy) (Table 2).
3.2.3 Preparation of Geology Map
Geology of an area plays a vital role in this study. Several rock formations give an
idea about the groundwater depth and subsurface flow characteristics. The map has
been prepared from the Geological Survey of India at a scale of 1:250,000. After
extracting the study area from the map, a vector layer is created over it to get the
characteristics and area of each geology type (Fig. 7).
3.2.4 Preparation of Geomorphology Map
Geomorphology tells us about the creation and transformation of topographic and
bathymetric features created by physical, chemical, or biological processes operating
at or near the earth’s surface. Geomorphology map is obtained from the Geological
Survey of India at a scale of 1:1,000,000, which is then georeferenced, and the study
area is extracted. After vectorization, the final geomorphology thematic layer map
is prepared (Fig. 8).
3.2.5 Rainfall Distribution Map
Rainfall is the main contributor for artificial recharge. Areas with more rainfall are
naturally more suitable for artificial recharge sites. Rainfall data for the area is downloaded from ECMWF [29]. This is utilized to develop the rainfall distribution map
using the Inverse Distance Weighted (IDW) interpolation technique in the ArcGIS
spatial analyst tool.
Inverse distance weighted (IDW) interpolation is a technique based on the assumption that objects closer to each other are more identical than those which are more
separated. The measured values around the prediction location have a more significant
impact on the forecasted value than those farther away. It gives higher importance
to points closest to the forecast location, and the weights decrease as a function