

126
W. Annayat and B. S. Sil
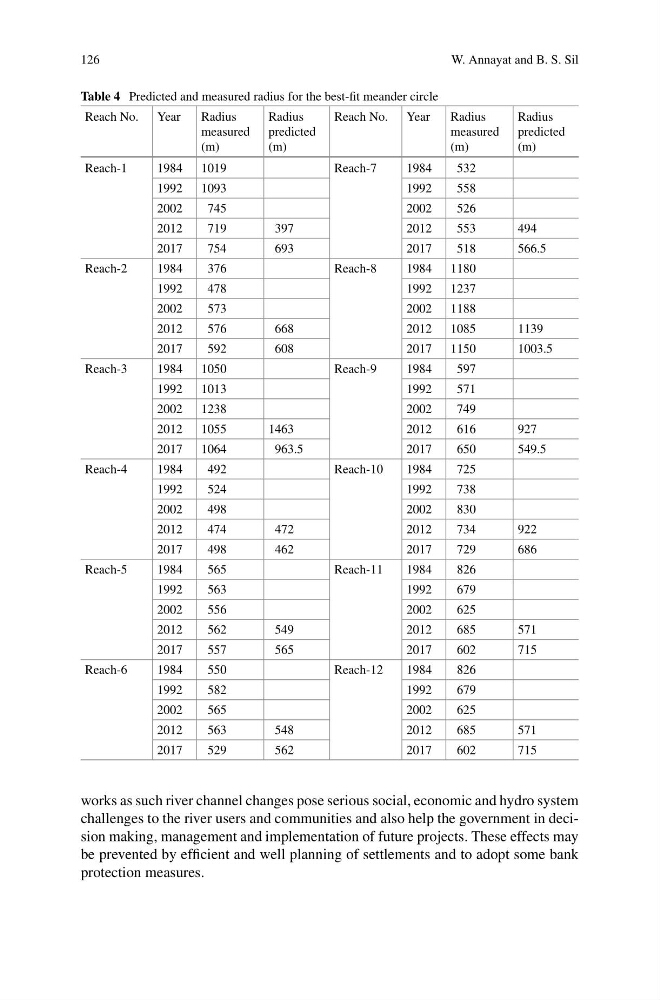
Table 4 Predicted and measured radius for the best-fit meander circle
Reach No. Year
Radius
measured
(m)
Radius
predicted
(m)
Reach No. Year
Radius
measured
(m)
Radius
predicted
(m)
Reach-1
1984 1019
Reach-7
1984
532
1992 1093
1992
558
2002
745
2002
526
2012
719
397
2012
553
494
2017
754
693
2017
518
566.5
Reach-2
1984
376
Reach-8
1984 1180
1992
478
1992 1237
2002
573
2002 1188
2012
576
668
2012 1085
1139
2017
592
608
2017 1150
1003.5
Reach-3
1984 1050
Reach-9
1984
597
1992 1013
1992
571
2002 1238
2002
749
2012 1055
1463
2012
616
927
2017 1064
963.5
2017
650
549.5
Reach-4
1984
492
Reach-10
1984
725
1992
524
1992
738
2002
498
2002
830
2012
474
472
2012
734
922
2017
498
462
2017
729
686
Reach-5
1984
565
Reach-11
1984
826
1992
563
1992
679
2002
556
2002
625
2012
562
549
2012
685
571
2017
557
565
2017
602
715
Reach-6
1984
550
Reach-12
1984
826
1992
582
1992
679
2002
565
2002
625
2012
563
548
2012
685
571
2017
529
562
2017
602
715
works as such river channel changes pose serious social, economic and hydro system
challenges to the river users and communities and also help the government in decision making, management and implementation of future projects. These effects may
be prevented by efficient and well planning of settlements and to adopt some bank
protection measures.
W. Annayat and B. S. Sil
Table 4 Predicted and measured radius for the best-fit meander circle
Reach No. Year
Radius
measured
(m)
Radius
predicted
(m)
Reach No. Year
Radius
measured
(m)
Radius
predicted
(m)
Reach-1
1984 1019
Reach-7
1984
532
1992 1093
1992
558
2002
745
2002
526
2012
719
397
2012
553
494
2017
754
693
2017
518
566.5
Reach-2
1984
376
Reach-8
1984 1180
1992
478
1992 1237
2002
573
2002 1188
2012
576
668
2012 1085
1139
2017
592
608
2017 1150
1003.5
Reach-3
1984 1050
Reach-9
1984
597
1992 1013
1992
571
2002 1238
2002
749
2012 1055
1463
2012
616
927
2017 1064
963.5
2017
650
549.5
Reach-4
1984
492
Reach-10
1984
725
1992
524
1992
738
2002
498
2002
830
2012
474
472
2012
734
922
2017
498
462
2017
729
686
Reach-5
1984
565
Reach-11
1984
826
1992
563
1992
679
2002
556
2002
625
2012
562
549
2012
685
571
2017
557
565
2017
602
715
Reach-6
1984
550
Reach-12
1984
826
1992
582
1992
679
2002
565
2002
625
2012
563
548
2012
685
571
2017
529
562
2017
602
715
works as such river channel changes pose serious social, economic and hydro system
challenges to the river users and communities and also help the government in decision making, management and implementation of future projects. These effects may
be prevented by efficient and well planning of settlements and to adopt some bank
protection measures.