

124
W. Annayat and B. S. Sil
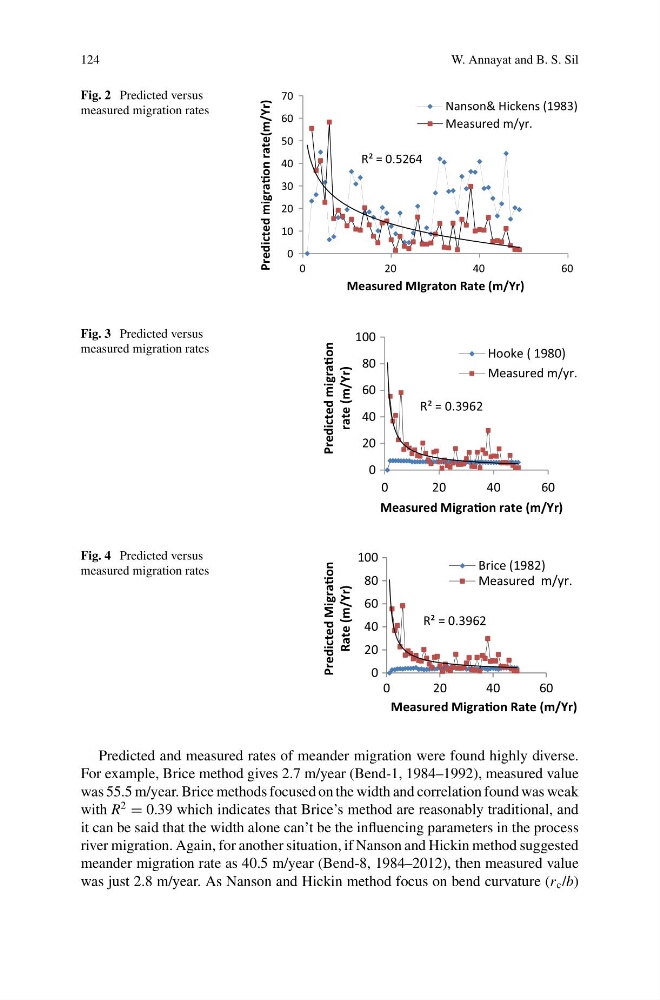
Fig. 2 Predicted versus
measured migration rates
R² = 0.5264
0
10
20
30
40
50
60
70
0
2 0
4 0
6 0
Predicted migraƟon rate(m/Yr)
Measured MIgraton Rate (m/Yr)
Nanson& Hickens (1983)
Measured m/yr.
Fig. 3 Predicted versus
measured migration rates
R² = 0.3962
0
20
40
60
80
100
0
2 0
4 0
6 0
Predicted migraƟon
rate (m/Yr)
Measured MigraƟon rate (m/Yr)
Hooke ( 1980)
Measured m/yr.
Fig. 4 Predicted versus
measured migration rates
R² = 0.3962
0
20
40
60
80
100
0
2 0
4 0
6 0
Predicted MigraƟon
Rate (m/Yr)
Measured MigraƟon Rate (m/Yr)
Brice (1982)
Measured m/yr.
Predicted and measured rates of meander migration were found highly diverse.
For example, Brice method gives 2.7 m/year (Bend-1, 1984–1992), measured value
was 55.5 m/year. Brice methods focused on the width and correlation found was weak
with R
2
= 0.39 which indicates that Brice’s method are reasonably traditional, and
it can be said that the width alone can’t be the influencing parameters in the process
river migration. Again, for another situation, if Nanson and Hickin method suggested
meander migration rate as 40.5 m/year (Bend-8, 1984–2012), then measured value
was just 2.8 m/year. As Nanson and Hickin method focus on bend curvature (r c /b)
W. Annayat and B. S. Sil
Fig. 2 Predicted versus
measured migration rates
R² = 0.5264
0
10
20
30
40
50
60
70
0
2 0
4 0
6 0
Predicted migraƟon rate(m/Yr)
Measured MIgraton Rate (m/Yr)
Nanson& Hickens (1983)
Measured m/yr.
Fig. 3 Predicted versus
measured migration rates
R² = 0.3962
0
20
40
60
80
100
0
2 0
4 0
6 0
Predicted migraƟon
rate (m/Yr)
Measured MigraƟon rate (m/Yr)
Hooke ( 1980)
Measured m/yr.
Fig. 4 Predicted versus
measured migration rates
R² = 0.3962
0
20
40
60
80
100
0
2 0
4 0
6 0
Predicted MigraƟon
Rate (m/Yr)
Measured MigraƟon Rate (m/Yr)
Brice (1982)
Measured m/yr.
Predicted and measured rates of meander migration were found highly diverse.
For example, Brice method gives 2.7 m/year (Bend-1, 1984–1992), measured value
was 55.5 m/year. Brice methods focused on the width and correlation found was weak
with R
2
= 0.39 which indicates that Brice’s method are reasonably traditional, and
it can be said that the width alone can’t be the influencing parameters in the process
river migration. Again, for another situation, if Nanson and Hickin method suggested
meander migration rate as 40.5 m/year (Bend-8, 1984–2012), then measured value
was just 2.8 m/year. As Nanson and Hickin method focus on bend curvature (r c /b)