

216
R. Singh et al.
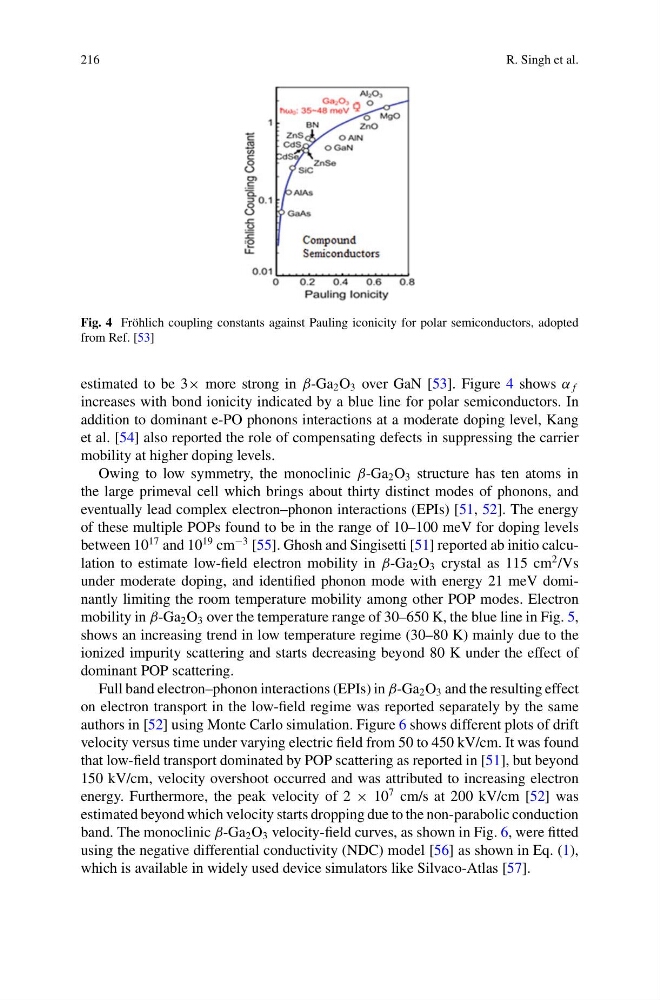
Fig. 4 Fröhlich coupling constants against Pauling iconicity for polar semiconductors, adopted
from Ref. [53]
estimated to be 3× more strong in β-Ga 2 O 3 over GaN [53]. Figure 4 shows α f
increases with bond ionicity indicated by a blue line for polar semiconductors. In
addition to dominant e-PO phonons interactions at a moderate doping level, Kang
et al. [54] also reported the role of compensating defects in suppressing the carrier
mobility at higher doping levels.
Owing to low symmetry, the monoclinic β-Ga 2 O 3 structure has ten atoms in
the large primeval cell which brings about thirty distinct modes of phonons, and
eventually lead complex electron–phonon interactions (EPIs) [51, 52]. The energy
of these multiple POPs found to be in the range of 10–100 meV for doping levels
between 10
17 and 10
19 cm
−3 [55]. Ghosh and Singisetti [51] reported ab initio calculation to estimate low-field electron mobility in β-Ga 2 O 3 crystal as 115 cm
2 /Vs
under moderate doping, and identified phonon mode with energy 21 meV dominantly limiting the room temperature mobility among other POP modes. Electron
mobility in β-Ga 2 O 3 over the temperature range of 30–650 K, the blue line in Fig. 5,
shows an increasing trend in low temperature regime (30–80 K) mainly due to the
ionized impurity scattering and starts decreasing beyond 80 K under the effect of
dominant POP scattering.
Full band electron–phonon interactions (EPIs) in β-Ga 2 O 3 and the resulting effect
on electron transport in the low-field regime was reported separately by the same
authors in [52] using Monte Carlo simulation. Figure 6 shows different plots of drift
velocity versus time under varying electric field from 50 to 450 kV/cm. It was found
that low-field transport dominated by POP scattering as reported in [51], but beyond
150 kV/cm, velocity overshoot occurred and was attributed to increasing electron
energy. Furthermore, the peak velocity of 2 × 10
7 cm/s at 200 kV/cm [52] was
estimated beyond which velocity starts dropping due to the non-parabolic conduction
band. The monoclinic β-Ga 2 O 3 velocity-field curves, as shown in Fig. 6, were fitted
using the negative differential conductivity (NDC) model [56] as shown in Eq. (1),
which is available in widely used device simulators like Silvaco-Atlas [57].
R. Singh et al.
Fig. 4 Fröhlich coupling constants against Pauling iconicity for polar semiconductors, adopted
from Ref. [53]
estimated to be 3× more strong in β-Ga 2 O 3 over GaN [53]. Figure 4 shows α f
increases with bond ionicity indicated by a blue line for polar semiconductors. In
addition to dominant e-PO phonons interactions at a moderate doping level, Kang
et al. [54] also reported the role of compensating defects in suppressing the carrier
mobility at higher doping levels.
Owing to low symmetry, the monoclinic β-Ga 2 O 3 structure has ten atoms in
the large primeval cell which brings about thirty distinct modes of phonons, and
eventually lead complex electron–phonon interactions (EPIs) [51, 52]. The energy
of these multiple POPs found to be in the range of 10–100 meV for doping levels
between 10
17 and 10
19 cm
−3 [55]. Ghosh and Singisetti [51] reported ab initio calculation to estimate low-field electron mobility in β-Ga 2 O 3 crystal as 115 cm
2 /Vs
under moderate doping, and identified phonon mode with energy 21 meV dominantly limiting the room temperature mobility among other POP modes. Electron
mobility in β-Ga 2 O 3 over the temperature range of 30–650 K, the blue line in Fig. 5,
shows an increasing trend in low temperature regime (30–80 K) mainly due to the
ionized impurity scattering and starts decreasing beyond 80 K under the effect of
dominant POP scattering.
Full band electron–phonon interactions (EPIs) in β-Ga 2 O 3 and the resulting effect
on electron transport in the low-field regime was reported separately by the same
authors in [52] using Monte Carlo simulation. Figure 6 shows different plots of drift
velocity versus time under varying electric field from 50 to 450 kV/cm. It was found
that low-field transport dominated by POP scattering as reported in [51], but beyond
150 kV/cm, velocity overshoot occurred and was attributed to increasing electron
energy. Furthermore, the peak velocity of 2 × 10
7 cm/s at 200 kV/cm [52] was
estimated beyond which velocity starts dropping due to the non-parabolic conduction
band. The monoclinic β-Ga 2 O 3 velocity-field curves, as shown in Fig. 6, were fitted
using the negative differential conductivity (NDC) model [56] as shown in Eq. (1),
which is available in widely used device simulators like Silvaco-Atlas [57].