

730
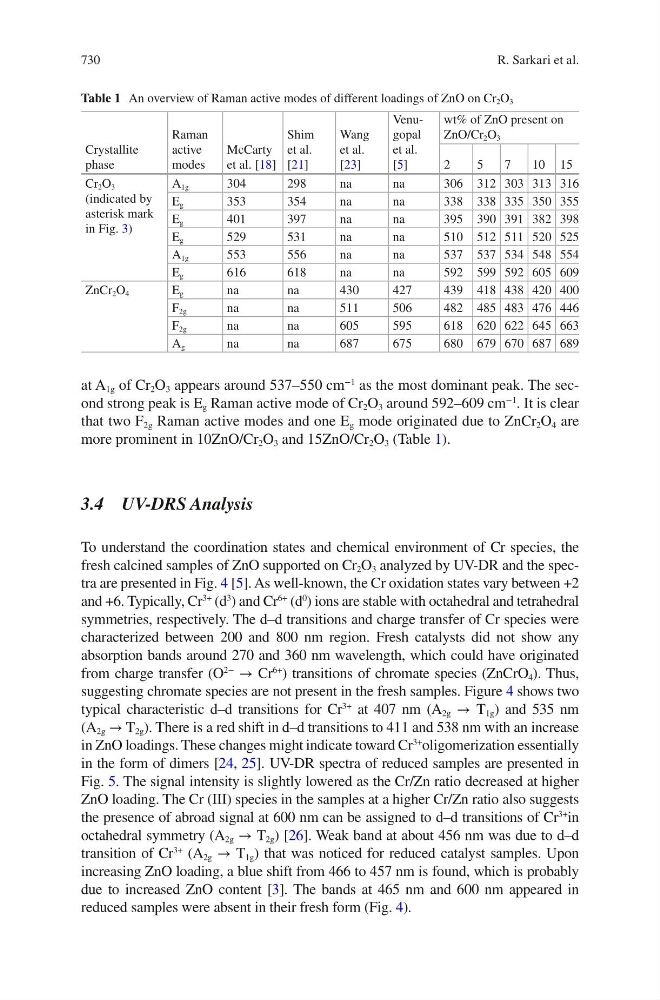
at A 1g of Cr 2 O 3 appears around 537–550 cm
−1
as the most dominant peak. The second strong peak is E g Raman active mode of Cr 2 O 3 around 592–609 cm
−1
. It is clear
that two F 2g Raman active modes and one E g mode originated due to ZnCr 2 O 4 are
more prominent in 10ZnO/Cr 2 O 3 and 15ZnO/Cr 2 O 3 (Table 1).
3.4 UV-DRS Analysis
To understand the coordination states and chemical environment of Cr species, the
fresh calcined samples of ZnO supported on Cr 2 O 3 analyzed by UV-DR and the spectra are presented in Fig. 4 [5]. As well-known, the Cr oxidation states vary between +2
and +6. Typically, Cr
3+
(d
3
) and Cr
6+
(d
0
) ions are stable with octahedral and tetrahedral
symmetries, respectively. The d–d transitions and charge transfer of Cr species were
characterized between 200 and 800 nm region. Fresh catalysts did not show any
absorption bands around 270 and 360 nm wavelength, which could have originated
from charge transfer (O
2−
→ Cr
6+
) transitions of chromate species (ZnCrO 4 ). Thus,
suggesting chromate species are not present in the fresh samples. Figure 4 shows two
typical characteristic d–d transitions for Cr
3+
at 407 nm (A 2g → T 1g ) and 535 nm
(A 2g → T 2g ). There is a red shift in d–d transitions to 411 and 538 nm with an increase
in ZnO loadings. These changes might indicate toward Cr
3+
oligomerization essentially
in the form of dimers [24, 25]. UV-DR spectra of reduced samples are presented in
Fig. 5. The signal intensity is slightly lowered as the Cr/Zn ratio decreased at higher
ZnO loading. The Cr (III) species in the samples at a higher Cr/Zn ratio also suggests
the presence of abroad signal at 600 nm can be assigned to d–d transitions of Cr
3+
in
octahedral symmetry (A 2g → T 2g ) [26]. Weak band at about 456 nm was due to d–d
transition of Cr
3+
(A 2g → T 1g ) that was noticed for reduced catalyst samples. Upon
increasing ZnO loading, a blue shift from 466 to 457 nm is found, which is probably
due to increased ZnO content [3]. The bands at 465 nm and 600 nm appeared in
reduced samples were absent in their fresh form (Fig. 4).
Table 1 An overview of Raman active modes of different loadings of ZnO on Cr 2 O 3
Crystallite
phase
Raman
active
modes
McCarty
et al. [18]
Shim
et al.
[21]
Wang
et al.
[23]
Venugopal
et al.
[5]
wt% of ZnO present on
ZnO/Cr 2 O 3
2
5
7
10 15
Cr 2 O 3
(indicated by
asterisk mark
in Fig. 3)
A 1g
304
298
na
na
306 312 303 313 316
E g
353
354
na
na
338 338 335 350 355
E g
401
397
na
na
395 390 391 382 398
E g
529
531
na
na
510 512 511 520 525
A 1g
553
556
na
na
537 537 534 548 554
E g
616
618
na
na
592 599 592 605 609
ZnCr 2 O 4
E g
na
na
430
427
439 418 438 420 400
F 2g
na
na
511
506
482 485 483 476 446
F 2g
na
na
605
595
618 620 622 645 663
A g
na
na
687
675
680 679 670 687 689
R. Sarkari et al.