

3.4 Methods and Materials
95
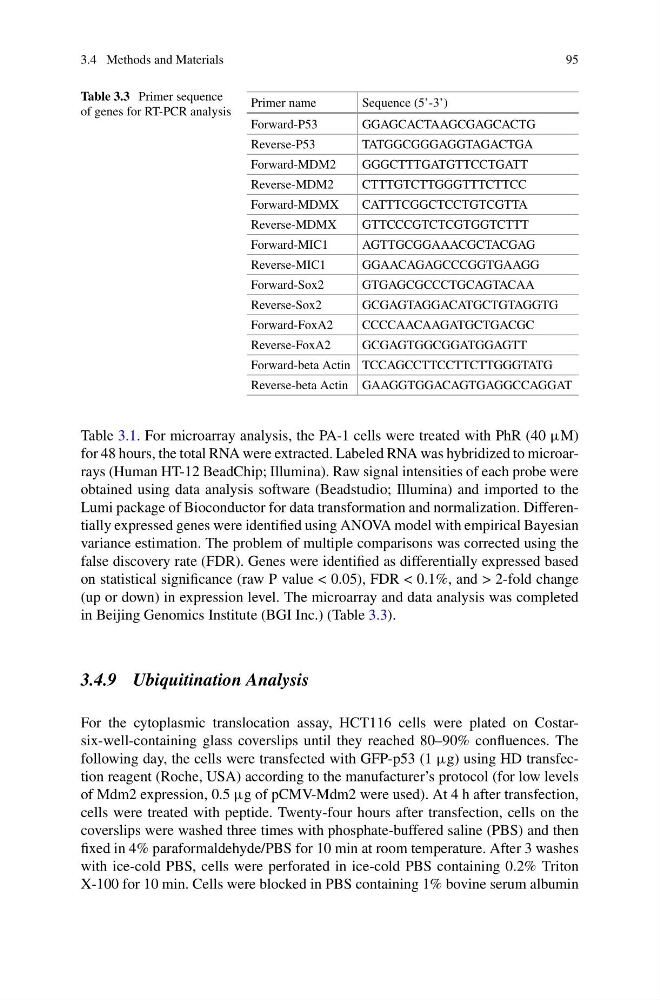
Table 3.3 Primer sequence
of genes for RT-PCR analysis
Primer name
Sequence (5’-3’)
Forward-P53
GGAGCACTAAGCGAGCACTG
Reverse-P53
TATGGCGGGAGGTAGACTGA
Forward-MDM2
GGGCTTTGATGTTCCTGATT
Reverse-MDM2
CTTTGTCTTGGGTTTCTTCC
Forward-MDMX
CATTTCGGCTCCTGTCGTTA
Reverse-MDMX
GTTCCCGTCTCGTGGTCTTT
Forward-MIC1
AGTTGCGGAAACGCTACGAG
Reverse-MIC1
GGAACAGAGCCCGGTGAAGG
Forward-Sox2
GTGAGCGCCCTGCAGTACAA
Reverse-Sox2
GCGAGTAGGACATGCTGTAGGTG
Forward-FoxA2
CCCCAACAAGATGCTGACGC
Reverse-FoxA2
GCGAGTGGCGGATGGAGTT
Forward-beta Actin TCCAGCCTTCCTTCTTGGGTATG
Reverse-beta Actin GAAGGTGGACAGTGAGGCCAGGAT
Table 3.1. For microarray analysis, the PA-1 cells were treated with PhR (40 μM)
for 48 hours, the total RNA were extracted. Labeled RNA was hybridized to microarrays (Human HT-12 BeadChip; Illumina). Raw signal intensities of each probe were
obtained using data analysis software (Beadstudio; Illumina) and imported to the
Lumi package of Bioconductor for data transformation and normalization. Differentially expressed genes were identified using ANOVA model with empirical Bayesian
variance estimation. The problem of multiple comparisons was corrected using the
false discovery rate (FDR). Genes were identified as differentially expressed based
on statistical significance (raw P value < 0.05), FDR < 0.1%, and > 2-fold change
(up or down) in expression level. The microarray and data analysis was completed
in Beijing Genomics Institute (BGI Inc.) (Table 3.3).
3.4.9 Ubiquitination Analysis
For the cytoplasmic translocation assay, HCT116 cells were plated on Costarsix-well-containing glass coverslips until they reached 80–90% confluences. The
following day, the cells were transfected with GFP-p53 (1 μg) using HD transfection reagent (Roche, USA) according to the manufacturer’s protocol (for low levels
of Mdm2 expression, 0.5 μg of pCMV-Mdm2 were used). At 4 h after transfection,
cells were treated with peptide. Twenty-four hours after transfection, cells on the
coverslips were washed three times with phosphate-buffered saline (PBS) and then
fixed in 4% paraformaldehyde/PBS for 10 min at room temperature. After 3 washes
with ice-cold PBS, cells were perforated in ice-cold PBS containing 0.2% Triton
X-100 for 10 min. Cells were blocked in PBS containing 1% bovine serum albumin
95
Table 3.3 Primer sequence
of genes for RT-PCR analysis
Primer name
Sequence (5’-3’)
Forward-P53
GGAGCACTAAGCGAGCACTG
Reverse-P53
TATGGCGGGAGGTAGACTGA
Forward-MDM2
GGGCTTTGATGTTCCTGATT
Reverse-MDM2
CTTTGTCTTGGGTTTCTTCC
Forward-MDMX
CATTTCGGCTCCTGTCGTTA
Reverse-MDMX
GTTCCCGTCTCGTGGTCTTT
Forward-MIC1
AGTTGCGGAAACGCTACGAG
Reverse-MIC1
GGAACAGAGCCCGGTGAAGG
Forward-Sox2
GTGAGCGCCCTGCAGTACAA
Reverse-Sox2
GCGAGTAGGACATGCTGTAGGTG
Forward-FoxA2
CCCCAACAAGATGCTGACGC
Reverse-FoxA2
GCGAGTGGCGGATGGAGTT
Forward-beta Actin TCCAGCCTTCCTTCTTGGGTATG
Reverse-beta Actin GAAGGTGGACAGTGAGGCCAGGAT
Table 3.1. For microarray analysis, the PA-1 cells were treated with PhR (40 μM)
for 48 hours, the total RNA were extracted. Labeled RNA was hybridized to microarrays (Human HT-12 BeadChip; Illumina). Raw signal intensities of each probe were
obtained using data analysis software (Beadstudio; Illumina) and imported to the
Lumi package of Bioconductor for data transformation and normalization. Differentially expressed genes were identified using ANOVA model with empirical Bayesian
variance estimation. The problem of multiple comparisons was corrected using the
false discovery rate (FDR). Genes were identified as differentially expressed based
on statistical significance (raw P value < 0.05), FDR < 0.1%, and > 2-fold change
(up or down) in expression level. The microarray and data analysis was completed
in Beijing Genomics Institute (BGI Inc.) (Table 3.3).
3.4.9 Ubiquitination Analysis
For the cytoplasmic translocation assay, HCT116 cells were plated on Costarsix-well-containing glass coverslips until they reached 80–90% confluences. The
following day, the cells were transfected with GFP-p53 (1 μg) using HD transfection reagent (Roche, USA) according to the manufacturer’s protocol (for low levels
of Mdm2 expression, 0.5 μg of pCMV-Mdm2 were used). At 4 h after transfection,
cells were treated with peptide. Twenty-four hours after transfection, cells on the
coverslips were washed three times with phosphate-buffered saline (PBS) and then
fixed in 4% paraformaldehyde/PBS for 10 min at room temperature. After 3 washes
with ice-cold PBS, cells were perforated in ice-cold PBS containing 0.2% Triton
X-100 for 10 min. Cells were blocked in PBS containing 1% bovine serum albumin