

The
14 C provides independent and additional constraints
for ocean circulation models validation beside conventional
tracers of the water masses (temperature, salinity), by
allowing estimates of the time constants of the ocean
ventilation.
Examples of Simulation of Modern Oceanic
Circulation
Figure 4.8 represents the
14 C distribution simulated with the
NEMO global ocean circulation model. The simulation is
evaluated using the GEOSECS data (Broecker et al. 1995;
Key et al. 1996). The model reproduces a realistic structure
of the ventilation of the deep ocean producing concentrations similar to observations. In particular, the ventilation
signature of the deep ocean associated with the Antarctic
deepwater formation coming from the Southern Ocean
(Antarctic Bottom Water AABW) is reproduced, characterized by high values of Δ
14 C at the ocean floor.
The eastern Pacific is characterized by a thick water mass
between 2000 m and 3500 m of almost homogeneous
14 C-depleted values at around −200 and −240‰. These
deep waters correspond to the oldest deep waters of the
world ocean with
14 C ages of 1790 years and 2200 years
respectively.
The temporal changes of the sea surface
14 C may be
measured from the annual growth bands of recent corals over
-42
-40
-38
-36
-34
8150
9150
10150
11150
12150
13150
14150
15150
16150
700
1200
1700
2200
7850
8850
9850
10850
11850
12850
13850
14850
15850
GISP2 δ18O (‰)
Calendar Ages BP (Years)
Dead carbon (years)
Calendar Ages BP (years)
B
9000
10000
11000
12000
13000
14000
15000
11000
12000
13000
14000
15000
16000
Radiocarbon ages (years BP)
1450 years
Dead Carbon
A
Calendar ages BP (years)
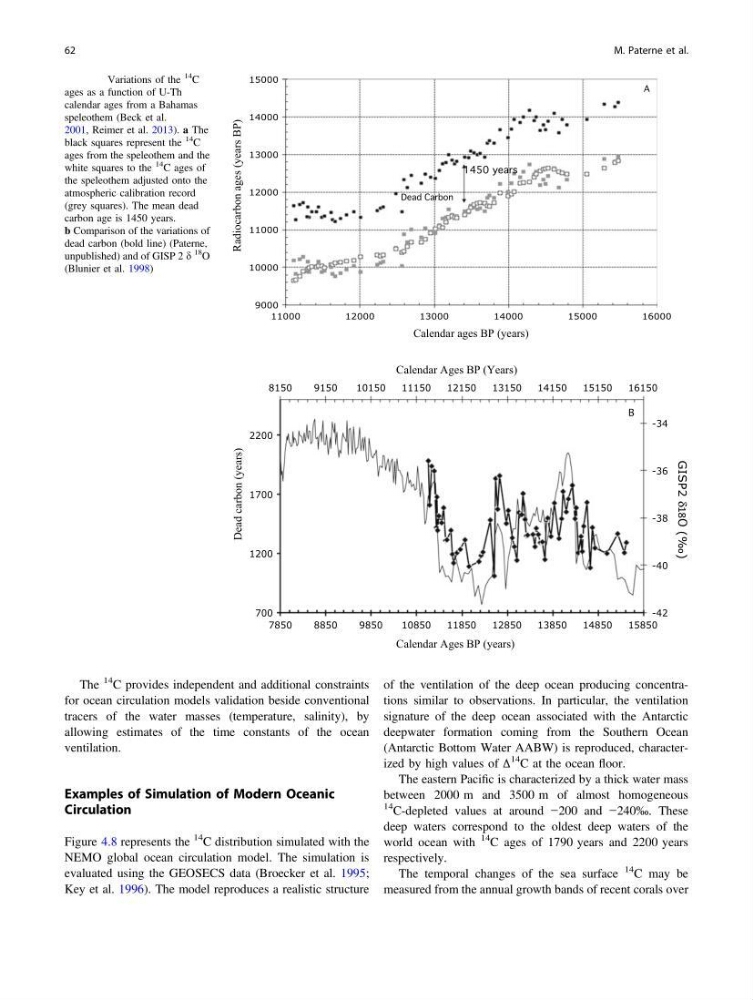
Fig. 4.7 Variations of the
14
C
ages as a function of U-Th
calendar ages from a Bahamas
speleothem (Beck et al.
2001, Reimer et al. 2013). a The
black squares represent the
14
C
ages from the speleothem and the
white squares to the
14
C ages of
the speleothem adjusted onto the
atmospheric calibration record
(grey squares). The mean dead
carbon age is 1450 years.
b Comparison of the variations of
dead carbon (bold line) (Paterne,
unpublished) and of GISP 2 d
18
O
(Blunier et al. 1998)
62
M. Paterne et al.
14 C provides independent and additional constraints
for ocean circulation models validation beside conventional
tracers of the water masses (temperature, salinity), by
allowing estimates of the time constants of the ocean
ventilation.
Examples of Simulation of Modern Oceanic
Circulation
Figure 4.8 represents the
14 C distribution simulated with the
NEMO global ocean circulation model. The simulation is
evaluated using the GEOSECS data (Broecker et al. 1995;
Key et al. 1996). The model reproduces a realistic structure
of the ventilation of the deep ocean producing concentrations similar to observations. In particular, the ventilation
signature of the deep ocean associated with the Antarctic
deepwater formation coming from the Southern Ocean
(Antarctic Bottom Water AABW) is reproduced, characterized by high values of Δ
14 C at the ocean floor.
The eastern Pacific is characterized by a thick water mass
between 2000 m and 3500 m of almost homogeneous
14 C-depleted values at around −200 and −240‰. These
deep waters correspond to the oldest deep waters of the
world ocean with
14 C ages of 1790 years and 2200 years
respectively.
The temporal changes of the sea surface
14 C may be
measured from the annual growth bands of recent corals over
-42
-40
-38
-36
-34
8150
9150
10150
11150
12150
13150
14150
15150
16150
700
1200
1700
2200
7850
8850
9850
10850
11850
12850
13850
14850
15850
GISP2 δ18O (‰)
Calendar Ages BP (Years)
Dead carbon (years)
Calendar Ages BP (years)
B
9000
10000
11000
12000
13000
14000
15000
11000
12000
13000
14000
15000
16000
Radiocarbon ages (years BP)
1450 years
Dead Carbon
A
Calendar ages BP (years)
Fig. 4.7 Variations of the
14
C
ages as a function of U-Th
calendar ages from a Bahamas
speleothem (Beck et al.
2001, Reimer et al. 2013). a The
black squares represent the
14
C
ages from the speleothem and the
white squares to the
14
C ages of
the speleothem adjusted onto the
atmospheric calibration record
(grey squares). The mean dead
carbon age is 1450 years.
b Comparison of the variations of
dead carbon (bold line) (Paterne,
unpublished) and of GISP 2 d
18
O
(Blunier et al. 1998)
62
M. Paterne et al.