

very far from the original regions, as far away as the South
Pacific and Antarctica, and including China and the northern
Indian Ocean, influenced by monsoons. The interpretation of
these data is based on the assumption that the time scales
associated with each record can be accurately synchronized.
This crucial synchronization is still a challenge despite
advances made in methods of relative synchronization (such
as methane concentration in ice cores or paleo-magnetic
properties in marine cores) for the scientific community
seeking to characterize rapid variability.
A comprehensive description on a global scale is very
important for our understanding of the climate and of the
8500
8400
8300
8200
8100
8000
-200
0
200
400
-32
-30
-28
-26
-24
-3
-2
-1
0
1
~3.3 +/- 1.1 ºC
Time (yearsB2K)
δ 18
O anomaly (‰)
Temperature (ºC)
Time (years)
Ensemble results for
simulated temperature
at Greenland summit
Fresh water
pulse
δ
18 O anomaly of
combined
NGRIP, GRIP
and DYE-3 ice
cores
Decadal average of
cooling from nitrogen
isotopes from GISP2:
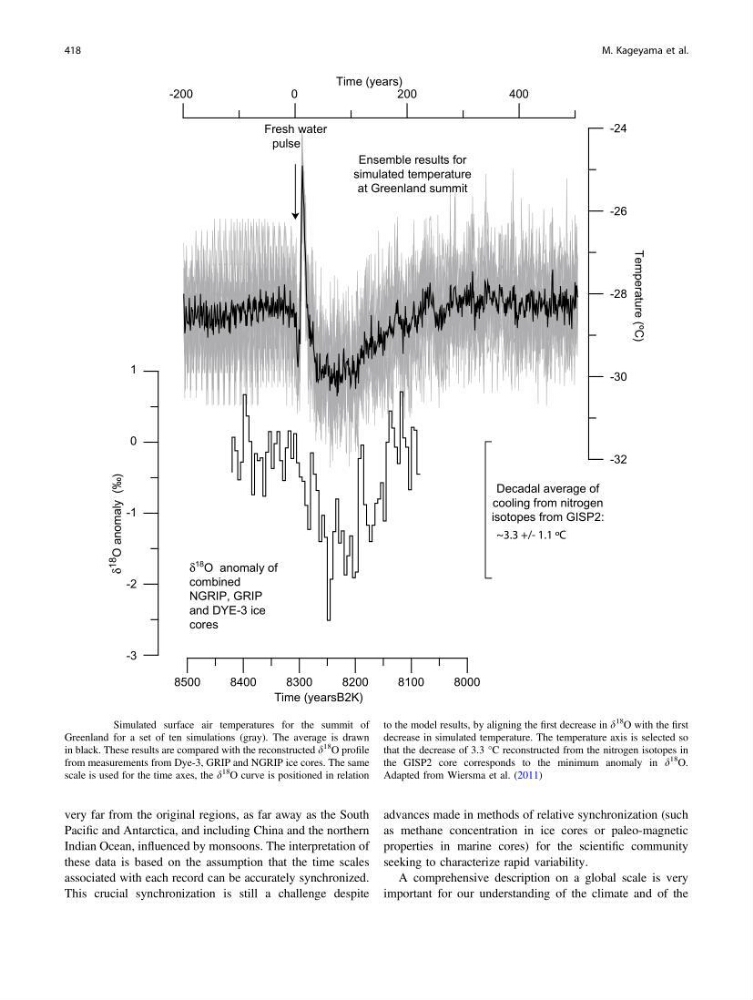
Fig. 29.6 Simulated surface air temperatures for the summit of
Greenland for a set of ten simulations (gray). The average is drawn
in black. These results are compared with the reconstructed d
18
O profile
from measurements from Dye-3, GRIP and NGRIP ice cores. The same
scale is used for the time axes, the d
18
O curve is positioned in relation
to the model results, by aligning the first decrease in d
18
O with the first
decrease in simulated temperature. The temperature axis is selected so
that the decrease of 3.3 °C reconstructed from the nitrogen isotopes in
the GISP2 core corresponds to the minimum anomaly in d
18
O.
Adapted from Wiersma et al. (2011)
418
M. Kageyama et al.
Pacific and Antarctica, and including China and the northern
Indian Ocean, influenced by monsoons. The interpretation of
these data is based on the assumption that the time scales
associated with each record can be accurately synchronized.
This crucial synchronization is still a challenge despite
advances made in methods of relative synchronization (such
as methane concentration in ice cores or paleo-magnetic
properties in marine cores) for the scientific community
seeking to characterize rapid variability.
A comprehensive description on a global scale is very
important for our understanding of the climate and of the
8500
8400
8300
8200
8100
8000
-200
0
200
400
-32
-30
-28
-26
-24
-3
-2
-1
0
1
~3.3 +/- 1.1 ºC
Time (yearsB2K)
δ 18
O anomaly (‰)
Temperature (ºC)
Time (years)
Ensemble results for
simulated temperature
at Greenland summit
Fresh water
pulse
δ
18 O anomaly of
combined
NGRIP, GRIP
and DYE-3 ice
cores
Decadal average of
cooling from nitrogen
isotopes from GISP2:
Fig. 29.6 Simulated surface air temperatures for the summit of
Greenland for a set of ten simulations (gray). The average is drawn
in black. These results are compared with the reconstructed d
18
O profile
from measurements from Dye-3, GRIP and NGRIP ice cores. The same
scale is used for the time axes, the d
18
O curve is positioned in relation
to the model results, by aligning the first decrease in d
18
O with the first
decrease in simulated temperature. The temperature axis is selected so
that the decrease of 3.3 °C reconstructed from the nitrogen isotopes in
the GISP2 core corresponds to the minimum anomaly in d
18
O.
Adapted from Wiersma et al. (2011)
418
M. Kageyama et al.