

types of reconstructions, marine and continental, are synchronized because they come from the same sediment core.
Thus, by looking for pollen associations that appeared at the
same time as the levels of detritus, the vegetation present
during Heinrich events can be reconstructed. More generally, it is possible to study the relationship between ocean
conditions and vegetation, as has been done for the Eastern
Atlantic, Mediterranean and the west coast of Europe
(Sánchez-Goñi et al. 2002; Combourieu-Nebout et al. 2002,
cf. Figure 29.2). The question is then to understand these
relationships. The climate in a region such as Western
Europe depends not only on the ocean surface conditions in
the North-East Atlantic and the Mediterranean, but also on
much more distant marine and continental conditions which
impact on atmospheric and oceanic circulation.
To continue with the example of the impact a Heinrich
event has on the climate and on the vegetation of Western
Europe, we have seen that the signature of this event in terms
of ocean surface temperature is firstly, a cold anomaly of
several degrees Celsius at the mid-latitudes of the North
Atlantic. We know, moreover, that at these latitudes the
atmospheric circulation is dominated by westerly winds.
A simple transmission mechanism of the oceanic signal
would be its advection, i.e. its transport, by the prevailing
atmospheric circulation, towards the ‘leeward’ continents, in
this case, Western Europe. However, it is difficult to estimate
how far the signal can travel and the atmospheric circulation
itself can be modified by the changes in sea surface temperatures. The initial response may also be reinforced or
negated by positive or negative feedbacks, such as, for
example, snow cover or clouds (Chap. 1). Another question
is: what can be said a priori about changes in precipitation
associated with a cold event in the North Atlantic? Two
processes need to be taken into account. A first constraint is
that a colder atmosphere contains less water vapor
(Clausius-Clapeyron relation) which makes it less conducive
to the formation of precipitation. Second, in the
mid-latitudes, over the oceans and the western side of the
continents, most precipitation comes from weather systems
that form over the oceans and pushed towards the western
coasts of the continents by the prevailing winds. These
perturbations are the result of atmospheric instabilities related to the meridional temperature gradient. A shift of the
areas of higher gradient is important because it causes a
displacement of the precipitation zones. A negative anomaly
of ocean surface temperatures at the mid-latitudes of the
North Atlantic implies a shift of the high meridional gradient
zone of ocean surface temperatures towards the south. This
should favor a southward migration of the prevailing wind
belt and the precipitation associated with weather systems. If
these weather systems are stronger, this can offset the direct
influence of temperature on precipitation. This shows how
important it is to have information from multiple locations in
order to interpret a given record. For example, in order to
interpret reconstructions of precipitations in Western Europe, it is important to know the temperatures in the region,
which, in general, is relatively easy to infer from the same
core, but it is also important to know the meridional temperature gradient over the North Atlantic and this requires
having data from several cores located far from, but yet
0
0.05
0.1
0.15
0.2
Fresh water flux
(Sverdrup)
1
1.5
2
2.5
δ 18
O
c
(per mil)
0
0
0
2
0
4000
6000
8000
10000
Run time (years)
3
3.5
4
4.5
δ 18
O
c
(per mil)
6
8
10
12
Temperature
(°C)
0
0.4
0.8
δ 18
O
w
(per mil)
(a)
(b)
(e)
(c)
(d)
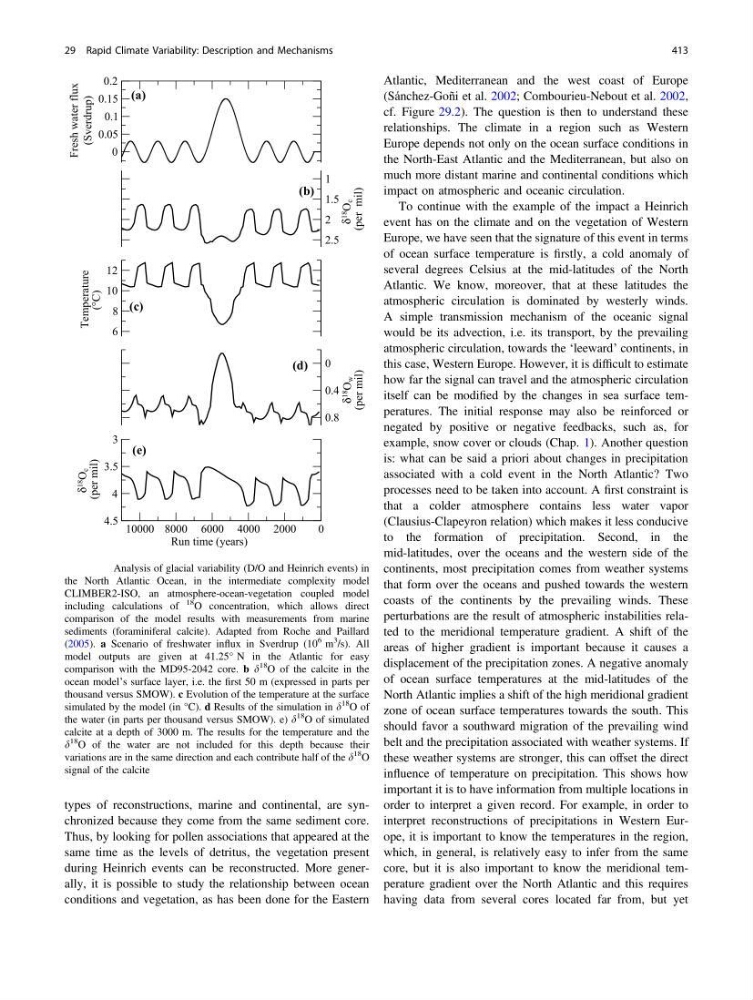
Fig. 29.4 Analysis of glacial variability (D/O and Heinrich events) in
the North Atlantic Ocean, in the intermediate complexity model
CLIMBER2-ISO, an atmosphere-ocean-vegetation coupled model
including calculations of
18 O concentration, which allows direct
comparison of the model results with measurements from marine
sediments (foraminiferal calcite). Adapted from Roche and Paillard
(2005). a Scenario of freshwater influx in Sverdrup (10
6 m
3
/s). All
model outputs are given at 41.25° N in the Atlantic for easy
comparison with the MD95-2042 core. b d
18
O of the calcite in the
ocean model’s surface layer, i.e. the first 50 m (expressed in parts per
thousand versus SMOW). c Evolution of the temperature at the surface
simulated by the model (in °C). d Results of the simulation in d
18
O of
the water (in parts per thousand versus SMOW). e) d
18
O of simulated
calcite at a depth of 3000 m. The results for the temperature and the
d
18
O of the water are not included for this depth because their
variations are in the same direction and each contribute half of the d
18
O
signal of the calcite
29 Rapid Climate Variability: Description and Mechanisms
413
Thus, by looking for pollen associations that appeared at the
same time as the levels of detritus, the vegetation present
during Heinrich events can be reconstructed. More generally, it is possible to study the relationship between ocean
conditions and vegetation, as has been done for the Eastern
Atlantic, Mediterranean and the west coast of Europe
(Sánchez-Goñi et al. 2002; Combourieu-Nebout et al. 2002,
cf. Figure 29.2). The question is then to understand these
relationships. The climate in a region such as Western
Europe depends not only on the ocean surface conditions in
the North-East Atlantic and the Mediterranean, but also on
much more distant marine and continental conditions which
impact on atmospheric and oceanic circulation.
To continue with the example of the impact a Heinrich
event has on the climate and on the vegetation of Western
Europe, we have seen that the signature of this event in terms
of ocean surface temperature is firstly, a cold anomaly of
several degrees Celsius at the mid-latitudes of the North
Atlantic. We know, moreover, that at these latitudes the
atmospheric circulation is dominated by westerly winds.
A simple transmission mechanism of the oceanic signal
would be its advection, i.e. its transport, by the prevailing
atmospheric circulation, towards the ‘leeward’ continents, in
this case, Western Europe. However, it is difficult to estimate
how far the signal can travel and the atmospheric circulation
itself can be modified by the changes in sea surface temperatures. The initial response may also be reinforced or
negated by positive or negative feedbacks, such as, for
example, snow cover or clouds (Chap. 1). Another question
is: what can be said a priori about changes in precipitation
associated with a cold event in the North Atlantic? Two
processes need to be taken into account. A first constraint is
that a colder atmosphere contains less water vapor
(Clausius-Clapeyron relation) which makes it less conducive
to the formation of precipitation. Second, in the
mid-latitudes, over the oceans and the western side of the
continents, most precipitation comes from weather systems
that form over the oceans and pushed towards the western
coasts of the continents by the prevailing winds. These
perturbations are the result of atmospheric instabilities related to the meridional temperature gradient. A shift of the
areas of higher gradient is important because it causes a
displacement of the precipitation zones. A negative anomaly
of ocean surface temperatures at the mid-latitudes of the
North Atlantic implies a shift of the high meridional gradient
zone of ocean surface temperatures towards the south. This
should favor a southward migration of the prevailing wind
belt and the precipitation associated with weather systems. If
these weather systems are stronger, this can offset the direct
influence of temperature on precipitation. This shows how
important it is to have information from multiple locations in
order to interpret a given record. For example, in order to
interpret reconstructions of precipitations in Western Europe, it is important to know the temperatures in the region,
which, in general, is relatively easy to infer from the same
core, but it is also important to know the meridional temperature gradient over the North Atlantic and this requires
having data from several cores located far from, but yet
0
0.05
0.1
0.15
0.2
Fresh water flux
(Sverdrup)
1
1.5
2
2.5
δ 18
O
c
(per mil)
0
0
0
2
0
4000
6000
8000
10000
Run time (years)
3
3.5
4
4.5
δ 18
O
c
(per mil)
6
8
10
12
Temperature
(°C)
0
0.4
0.8
δ 18
O
w
(per mil)
(a)
(b)
(e)
(c)
(d)
Fig. 29.4 Analysis of glacial variability (D/O and Heinrich events) in
the North Atlantic Ocean, in the intermediate complexity model
CLIMBER2-ISO, an atmosphere-ocean-vegetation coupled model
including calculations of
18 O concentration, which allows direct
comparison of the model results with measurements from marine
sediments (foraminiferal calcite). Adapted from Roche and Paillard
(2005). a Scenario of freshwater influx in Sverdrup (10
6 m
3
/s). All
model outputs are given at 41.25° N in the Atlantic for easy
comparison with the MD95-2042 core. b d
18
O of the calcite in the
ocean model’s surface layer, i.e. the first 50 m (expressed in parts per
thousand versus SMOW). c Evolution of the temperature at the surface
simulated by the model (in °C). d Results of the simulation in d
18
O of
the water (in parts per thousand versus SMOW). e) d
18
O of simulated
calcite at a depth of 3000 m. The results for the temperature and the
d
18
O of the water are not included for this depth because their
variations are in the same direction and each contribute half of the d
18
O
signal of the calcite
29 Rapid Climate Variability: Description and Mechanisms
413