

other parts of the world, in some cases far from the North
Atlantic. Abrupt changes in the dD of the ice at Vostok in
Antarctica were reported as early as 1994 by the team of M.
Bender, who established a correlation with the Greenland
records, through the oxygen isotopes in the air preserved in
the ice. In 1995, abrupt changes in ventilation were observed
in the Santa Barbara Basin off California. In 1998, abrupt
changes in biological productivity in the Arabian Sea,
strongly related to monsoon intensity, were shown over time
scales similar to Dansgaard-Oeschger cycles. In 2000, significant variations in the hydrological cycle in the low latitudes of the North Atlantic (Cariaco basin) were shown to
correspond with events observed in the North Atlantic.
Voelker et al. (2002) list 183 sites where variations of this
type are recorded. Since this review, new records have been
produced, confirming the global nature of these abrupt climate variations, and suggesting the involvement of a
mechanism operating on a global scale.
Rapid climate variations of great amplitude have thus
been found at many points on the globe. The most difficult
part of interpreting these records is to synchronize them. The
ideal would be to have an absolute dating for each record, on
the same scale of the abrupt events, i.e., on a decadal scale.
For most paleoclimate indicators, this is impossible to
obtain. A dating method such as that based on
14 C does not
offer sufficient precision over the glacial period to be able to
link abrupt events recorded in two different places, in other
words, to establish the phase differences between the various
0
20
40
30
10
50
0
20
40
60
2
3
4
7
8
11
12
5
6
1
10
2
3
4
7
8
9
10
11
12
5
6
1
- 45
-40
-35
0
20
40
60
0
5
15
10
20
0 10 20
0 10
YD
H1
H2
H3
H4
H5
h
3 2 1
0
2
3
4
7
8
11
12
5
6
1
10
T e m
p e r a t e f o r e s t
( %
)
S e m
i - d e s e r t
( %
)
N e o g l o b o q u a d r i n a
p a c h y d e r m
a l . c . ( %
)
B i t e c t a t o d i n i u m
t e p i k i e n s e ( %
) δ 1 8
O
( ‰
) P D B
G . b u l l o ï d e s
MEDITERRANEAN AREA: ODP Site 976
δ 18 O (‰) PDB
GREENLAND
GISP 2
Age (10
3
calendar yr)
Depth (mcd)
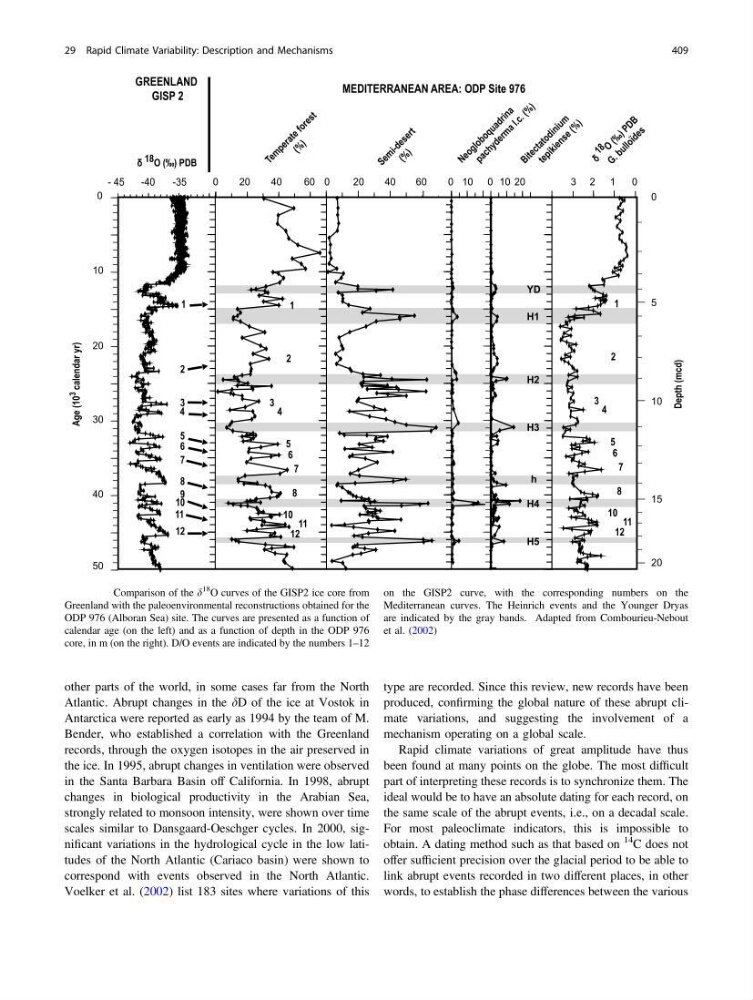
Fig. 29.2 Comparison of the d
18
O curves of the GISP2 ice core from
Greenland with the paleoenvironmental reconstructions obtained for the
ODP 976 (Alboran Sea) site. The curves are presented as a function of
calendar age (on the left) and as a function of depth in the ODP 976
core, in m (on the right). D/O events are indicated by the numbers 1–12
on the GISP2 curve, with the corresponding numbers on the
Mediterranean curves. The Heinrich events and the Younger Dryas
are indicated by the gray bands. Adapted from Combourieu-Nebout
et al. (2002)
29 Rapid Climate Variability: Description and Mechanisms
409
Atlantic. Abrupt changes in the dD of the ice at Vostok in
Antarctica were reported as early as 1994 by the team of M.
Bender, who established a correlation with the Greenland
records, through the oxygen isotopes in the air preserved in
the ice. In 1995, abrupt changes in ventilation were observed
in the Santa Barbara Basin off California. In 1998, abrupt
changes in biological productivity in the Arabian Sea,
strongly related to monsoon intensity, were shown over time
scales similar to Dansgaard-Oeschger cycles. In 2000, significant variations in the hydrological cycle in the low latitudes of the North Atlantic (Cariaco basin) were shown to
correspond with events observed in the North Atlantic.
Voelker et al. (2002) list 183 sites where variations of this
type are recorded. Since this review, new records have been
produced, confirming the global nature of these abrupt climate variations, and suggesting the involvement of a
mechanism operating on a global scale.
Rapid climate variations of great amplitude have thus
been found at many points on the globe. The most difficult
part of interpreting these records is to synchronize them. The
ideal would be to have an absolute dating for each record, on
the same scale of the abrupt events, i.e., on a decadal scale.
For most paleoclimate indicators, this is impossible to
obtain. A dating method such as that based on
14 C does not
offer sufficient precision over the glacial period to be able to
link abrupt events recorded in two different places, in other
words, to establish the phase differences between the various
0
20
40
30
10
50
0
20
40
60
2
3
4
7
8
11
12
5
6
1
10
2
3
4
7
8
9
10
11
12
5
6
1
- 45
-40
-35
0
20
40
60
0
5
15
10
20
0 10 20
0 10
YD
H1
H2
H3
H4
H5
h
3 2 1
0
2
3
4
7
8
11
12
5
6
1
10
T e m
p e r a t e f o r e s t
( %
)
S e m
i - d e s e r t
( %
)
N e o g l o b o q u a d r i n a
p a c h y d e r m
a l . c . ( %
)
B i t e c t a t o d i n i u m
t e p i k i e n s e ( %
) δ 1 8
O
( ‰
) P D B
G . b u l l o ï d e s
MEDITERRANEAN AREA: ODP Site 976
δ 18 O (‰) PDB
GREENLAND
GISP 2
Age (10
3
calendar yr)
Depth (mcd)
Fig. 29.2 Comparison of the d
18
O curves of the GISP2 ice core from
Greenland with the paleoenvironmental reconstructions obtained for the
ODP 976 (Alboran Sea) site. The curves are presented as a function of
calendar age (on the left) and as a function of depth in the ODP 976
core, in m (on the right). D/O events are indicated by the numbers 1–12
on the GISP2 curve, with the corresponding numbers on the
Mediterranean curves. The Heinrich events and the Younger Dryas
are indicated by the gray bands. Adapted from Combourieu-Nebout
et al. (2002)
29 Rapid Climate Variability: Description and Mechanisms
409