

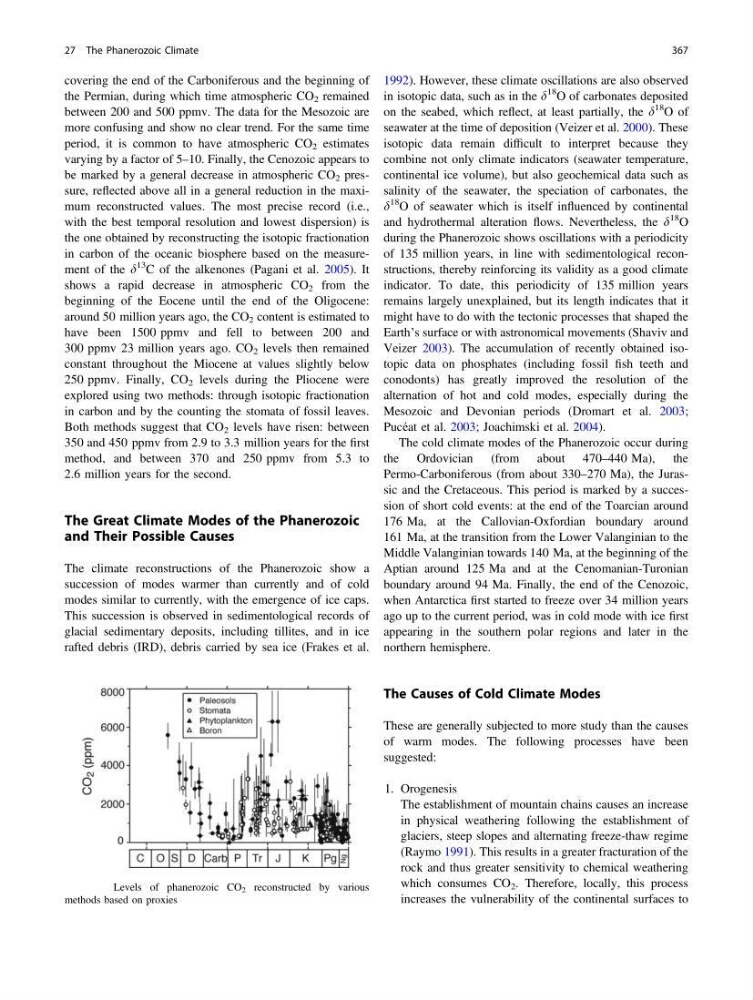
covering the end of the Carboniferous and the beginning of
the Permian, during which time atmospheric CO 2 remained
between 200 and 500 ppmv. The data for the Mesozoic are
more confusing and show no clear trend. For the same time
period, it is common to have atmospheric CO 2 estimates
varying by a factor of 5–10. Finally, the Cenozoic appears to
be marked by a general decrease in atmospheric CO 2 pressure, reflected above all in a general reduction in the maximum reconstructed values. The most precise record (i.e.,
with the best temporal resolution and lowest dispersion) is
the one obtained by reconstructing the isotopic fractionation
in carbon of the oceanic biosphere based on the measurement of the d
13 C of the alkenones (Pagani et al. 2005). It
shows a rapid decrease in atmospheric CO 2 from the
beginning of the Eocene until the end of the Oligocene:
around 50 million years ago, the CO 2 content is estimated to
have been 1500 ppmv and fell to between 200 and
300 ppmv 23 million years ago. CO 2 levels then remained
constant throughout the Miocene at values slightly below
250 ppmv. Finally, CO 2 levels during the Pliocene were
explored using two methods: through isotopic fractionation
in carbon and by the counting the stomata of fossil leaves.
Both methods suggest that CO 2 levels have risen: between
350 and 450 ppmv from 2.9 to 3.3 million years for the first
method, and between 370 and 250 ppmv from 5.3 to
2.6 million years for the second.
The Great Climate Modes of the Phanerozoic
and Their Possible Causes
The climate reconstructions of the Phanerozoic show a
succession of modes warmer than currently and of cold
modes similar to currently, with the emergence of ice caps.
This succession is observed in sedimentological records of
glacial sedimentary deposits, including tillites, and in ice
rafted debris (IRD), debris carried by sea ice (Frakes et al.
1992). However, these climate oscillations are also observed
in isotopic data, such as in the d
18 O of carbonates deposited
on the seabed, which reflect, at least partially, the d
18 O of
seawater at the time of deposition (Veizer et al. 2000). These
isotopic data remain difficult to interpret because they
combine not only climate indicators (seawater temperature,
continental ice volume), but also geochemical data such as
salinity of the seawater, the speciation of carbonates, the
d
18 O of seawater which is itself influenced by continental
and hydrothermal alteration flows. Nevertheless, the d
18
O
during the Phanerozoic shows oscillations with a periodicity
of 135 million years, in line with sedimentological reconstructions, thereby reinforcing its validity as a good climate
indicator. To date, this periodicity of 135 million years
remains largely unexplained, but its length indicates that it
might have to do with the tectonic processes that shaped the
Earth’s surface or with astronomical movements (Shaviv and
Veizer 2003). The accumulation of recently obtained isotopic data on phosphates (including fossil fish teeth and
conodonts) has greatly improved the resolution of the
alternation of hot and cold modes, especially during the
Mesozoic and Devonian periods (Dromart et al. 2003;
Pucéat et al. 2003; Joachimski et al. 2004).
The cold climate modes of the Phanerozoic occur during
the Ordovician (from about 470–440 Ma), the
Permo-Carboniferous (from about 330–270 Ma), the Jurassic and the Cretaceous. This period is marked by a succession of short cold events: at the end of the Toarcian around
176 Ma, at the Callovian-Oxfordian boundary around
161 Ma, at the transition from the Lower Valanginian to the
Middle Valanginian towards 140 Ma, at the beginning of the
Aptian around 125 Ma and at the Cenomanian-Turonian
boundary around 94 Ma. Finally, the end of the Cenozoic,
when Antarctica first started to freeze over 34 million years
ago up to the current period, was in cold mode with ice first
appearing in the southern polar regions and later in the
northern hemisphere.
The Causes of Cold Climate Modes
These are generally subjected to more study than the causes
of warm modes. The following processes have been
suggested:
1. Orogenesis
The establishment of mountain chains causes an increase
in physical weathering following the establishment of
glaciers, steep slopes and alternating freeze-thaw regime
(Raymo 1991). This results in a greater fracturation of the
rock and thus greater sensitivity to chemical weathering
which consumes CO 2 . Therefore, locally, this process
increases the vulnerability of the continental surfaces to
Fig. 27.6 Levels of phanerozoic CO 2 reconstructed by various
methods based on proxies
27 The Phanerozoic Climate
367
the Permian, during which time atmospheric CO 2 remained
between 200 and 500 ppmv. The data for the Mesozoic are
more confusing and show no clear trend. For the same time
period, it is common to have atmospheric CO 2 estimates
varying by a factor of 5–10. Finally, the Cenozoic appears to
be marked by a general decrease in atmospheric CO 2 pressure, reflected above all in a general reduction in the maximum reconstructed values. The most precise record (i.e.,
with the best temporal resolution and lowest dispersion) is
the one obtained by reconstructing the isotopic fractionation
in carbon of the oceanic biosphere based on the measurement of the d
13 C of the alkenones (Pagani et al. 2005). It
shows a rapid decrease in atmospheric CO 2 from the
beginning of the Eocene until the end of the Oligocene:
around 50 million years ago, the CO 2 content is estimated to
have been 1500 ppmv and fell to between 200 and
300 ppmv 23 million years ago. CO 2 levels then remained
constant throughout the Miocene at values slightly below
250 ppmv. Finally, CO 2 levels during the Pliocene were
explored using two methods: through isotopic fractionation
in carbon and by the counting the stomata of fossil leaves.
Both methods suggest that CO 2 levels have risen: between
350 and 450 ppmv from 2.9 to 3.3 million years for the first
method, and between 370 and 250 ppmv from 5.3 to
2.6 million years for the second.
The Great Climate Modes of the Phanerozoic
and Their Possible Causes
The climate reconstructions of the Phanerozoic show a
succession of modes warmer than currently and of cold
modes similar to currently, with the emergence of ice caps.
This succession is observed in sedimentological records of
glacial sedimentary deposits, including tillites, and in ice
rafted debris (IRD), debris carried by sea ice (Frakes et al.
1992). However, these climate oscillations are also observed
in isotopic data, such as in the d
18 O of carbonates deposited
on the seabed, which reflect, at least partially, the d
18 O of
seawater at the time of deposition (Veizer et al. 2000). These
isotopic data remain difficult to interpret because they
combine not only climate indicators (seawater temperature,
continental ice volume), but also geochemical data such as
salinity of the seawater, the speciation of carbonates, the
d
18 O of seawater which is itself influenced by continental
and hydrothermal alteration flows. Nevertheless, the d
18
O
during the Phanerozoic shows oscillations with a periodicity
of 135 million years, in line with sedimentological reconstructions, thereby reinforcing its validity as a good climate
indicator. To date, this periodicity of 135 million years
remains largely unexplained, but its length indicates that it
might have to do with the tectonic processes that shaped the
Earth’s surface or with astronomical movements (Shaviv and
Veizer 2003). The accumulation of recently obtained isotopic data on phosphates (including fossil fish teeth and
conodonts) has greatly improved the resolution of the
alternation of hot and cold modes, especially during the
Mesozoic and Devonian periods (Dromart et al. 2003;
Pucéat et al. 2003; Joachimski et al. 2004).
The cold climate modes of the Phanerozoic occur during
the Ordovician (from about 470–440 Ma), the
Permo-Carboniferous (from about 330–270 Ma), the Jurassic and the Cretaceous. This period is marked by a succession of short cold events: at the end of the Toarcian around
176 Ma, at the Callovian-Oxfordian boundary around
161 Ma, at the transition from the Lower Valanginian to the
Middle Valanginian towards 140 Ma, at the beginning of the
Aptian around 125 Ma and at the Cenomanian-Turonian
boundary around 94 Ma. Finally, the end of the Cenozoic,
when Antarctica first started to freeze over 34 million years
ago up to the current period, was in cold mode with ice first
appearing in the southern polar regions and later in the
northern hemisphere.
The Causes of Cold Climate Modes
These are generally subjected to more study than the causes
of warm modes. The following processes have been
suggested:
1. Orogenesis
The establishment of mountain chains causes an increase
in physical weathering following the establishment of
glaciers, steep slopes and alternating freeze-thaw regime
(Raymo 1991). This results in a greater fracturation of the
rock and thus greater sensitivity to chemical weathering
which consumes CO 2 . Therefore, locally, this process
increases the vulnerability of the continental surfaces to
Fig. 27.6 Levels of phanerozoic CO 2 reconstructed by various
methods based on proxies
27 The Phanerozoic Climate
367